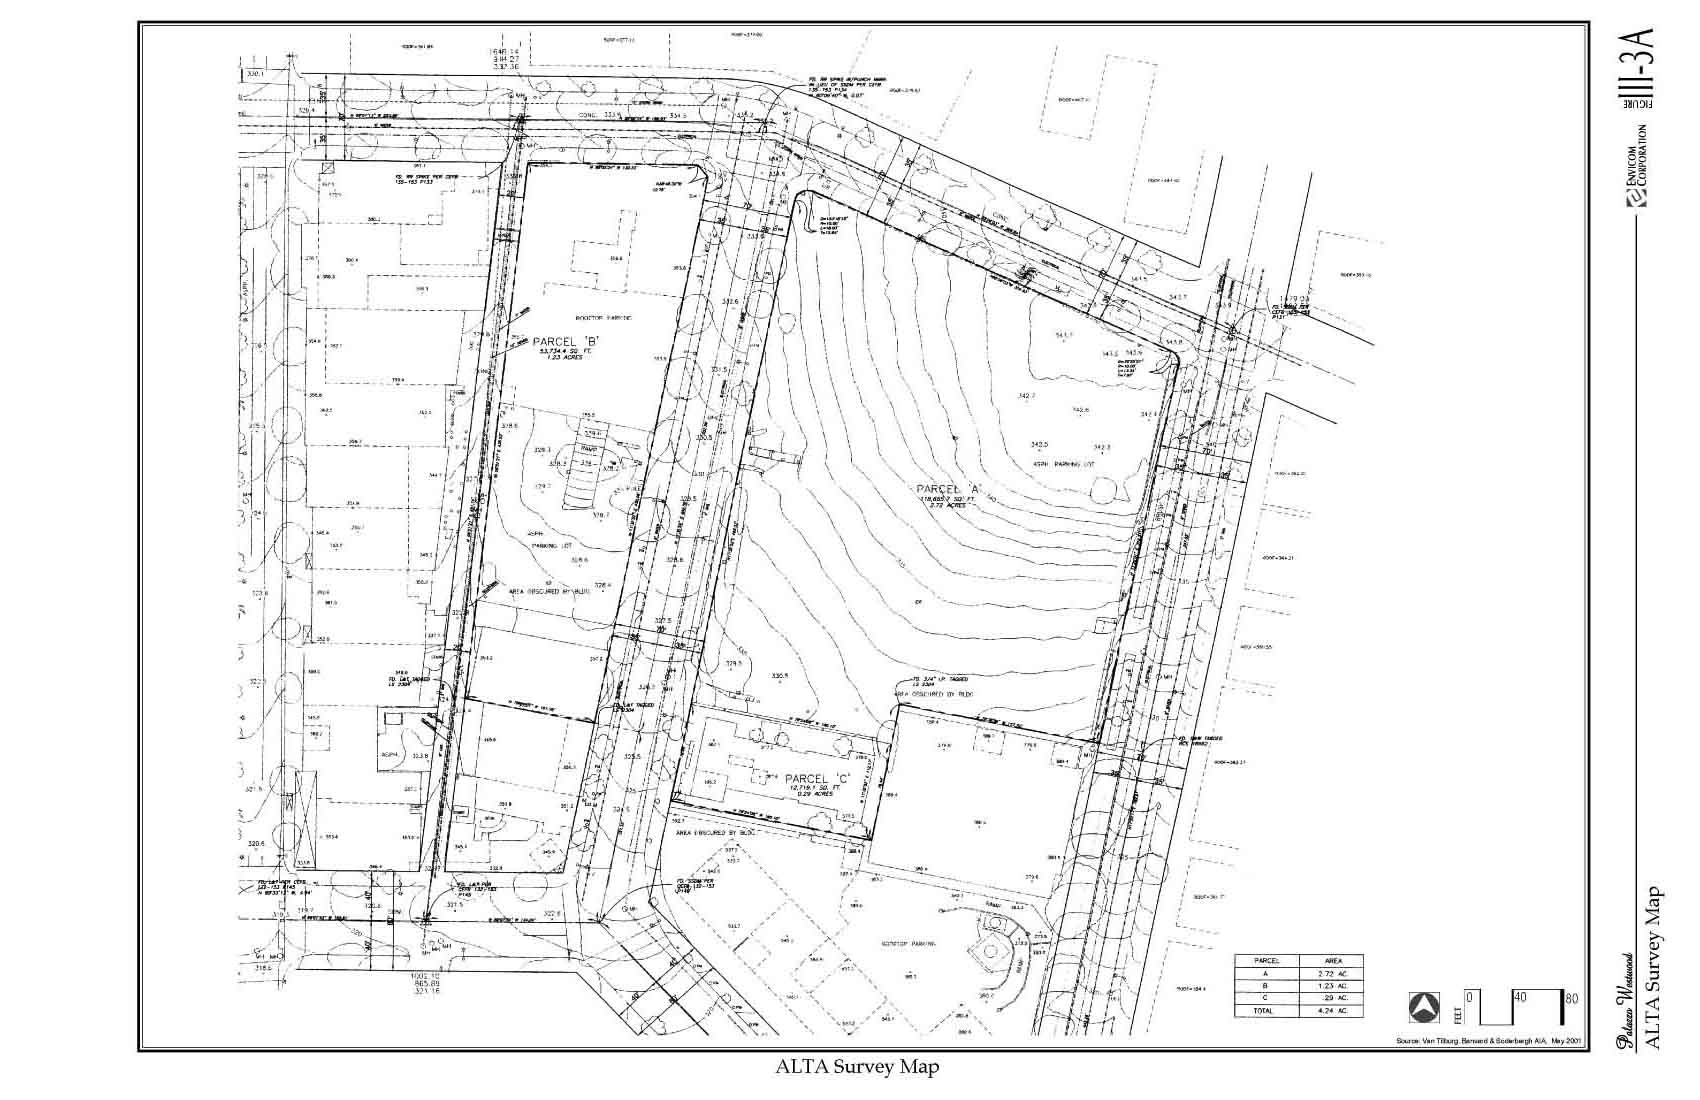
The Palazzo Westwood Project is a mixed use development comprised of 350 residential apartments (413,490 sq. ft.) and 115,000 square feet of commercial retail uses on a 4.24 -acre site, located southwesterly of the intersection of Weyburn and Tiverton. The Project is proposed on a site that currently includes parking spaces, vacant areas (previously occupied by the recently demolished commercial retail building and parking spaces on the west side of Glendon Avenue), a motion picture theater, and a vacant 42-unit apartment building known as Glendon Manor (see Chapter II. Project Description, for a complete description).
Graphic exhibits from the Draft Environmental Impact Report are available on-line. Files are provided as jpegs. Click here to view the Table of Contents for the text.
LIST OF FIGURES
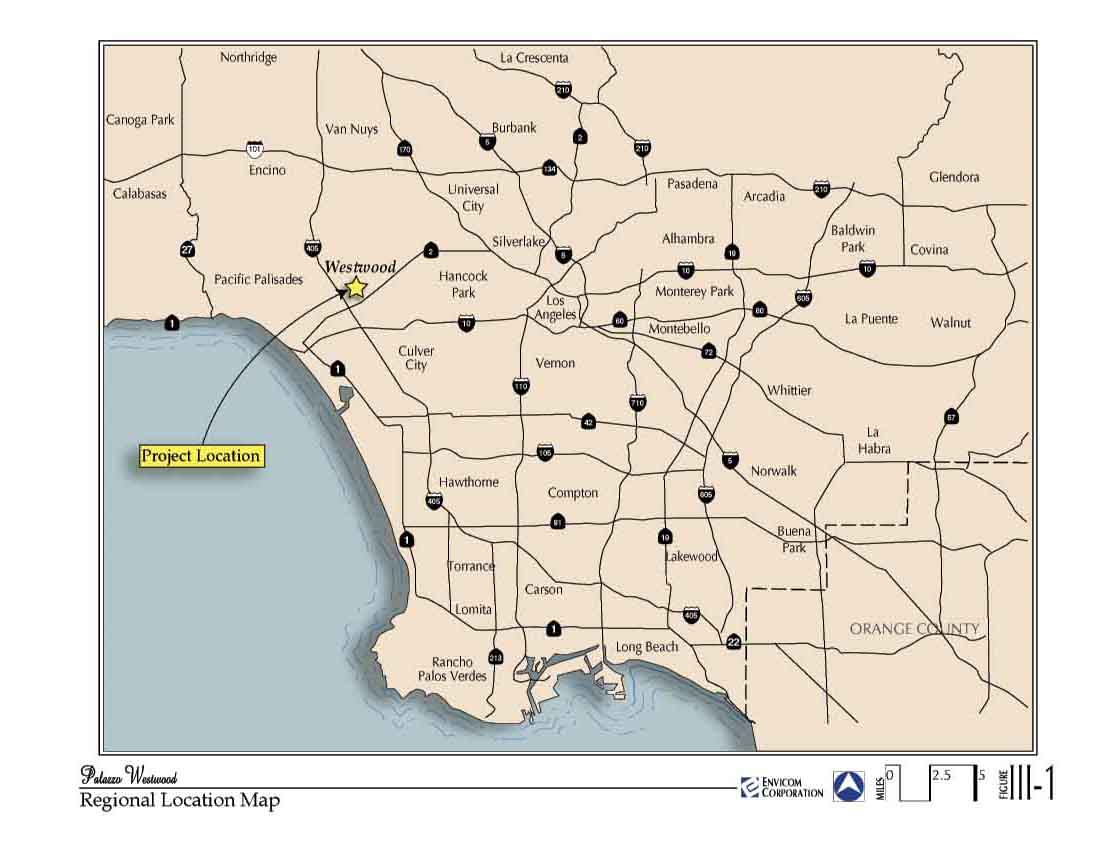
Figure III-1 Regional Location (89k)
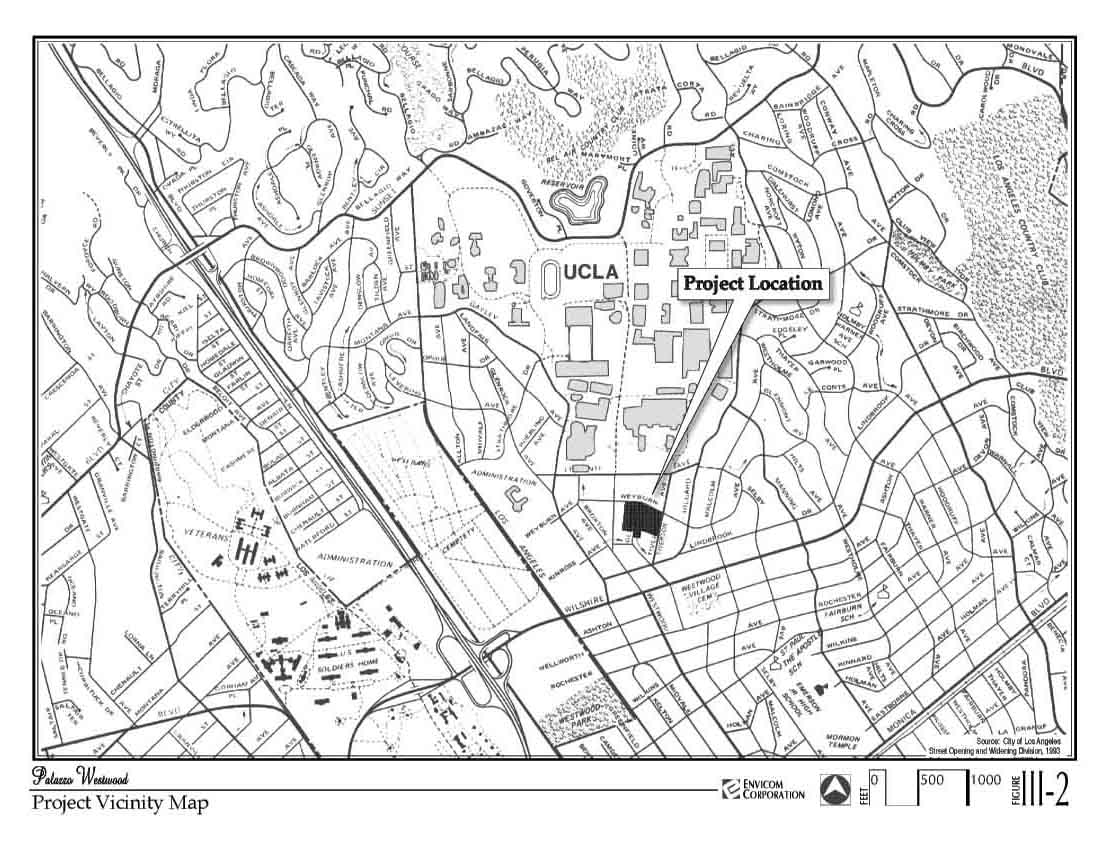
Figure III-2 Vicinity Map (156k)
Figure III-3 Alta Survey Map (177k)
Figure III-3b Preliminary Parcel Map (251k)
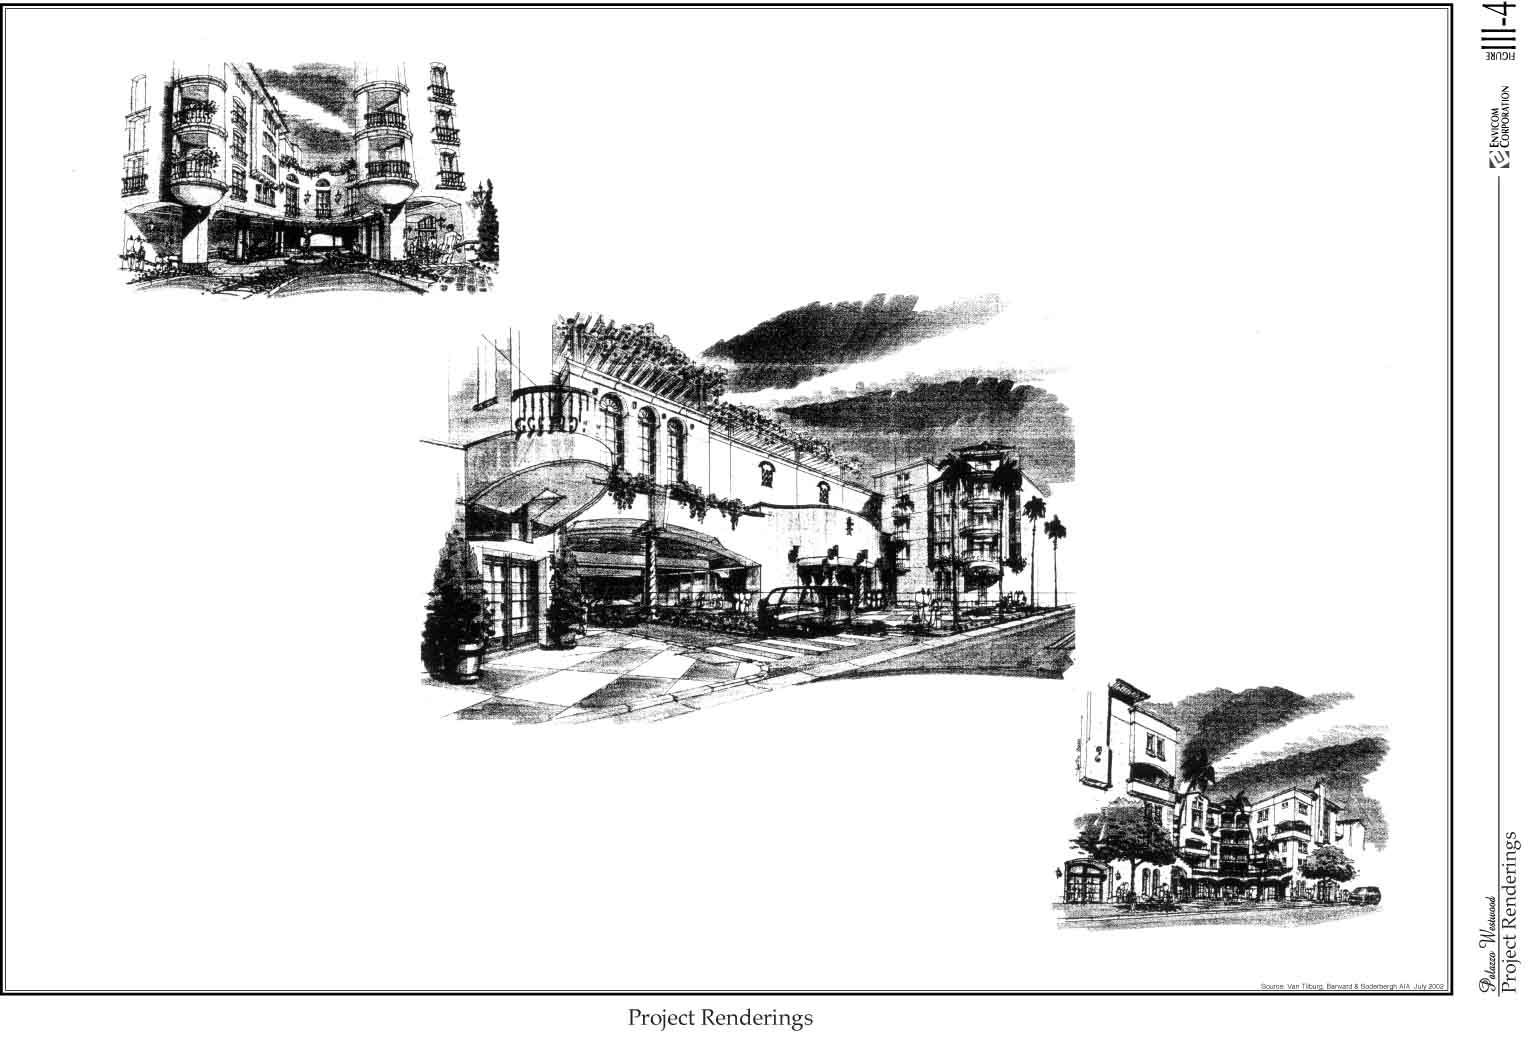
Figure III-4 Project Renderings (135k)
Figure III-5 Ground Floor Street Level Plan (153k)
Figure III-6 First Level Residential "Podium Level Plan" (192k)
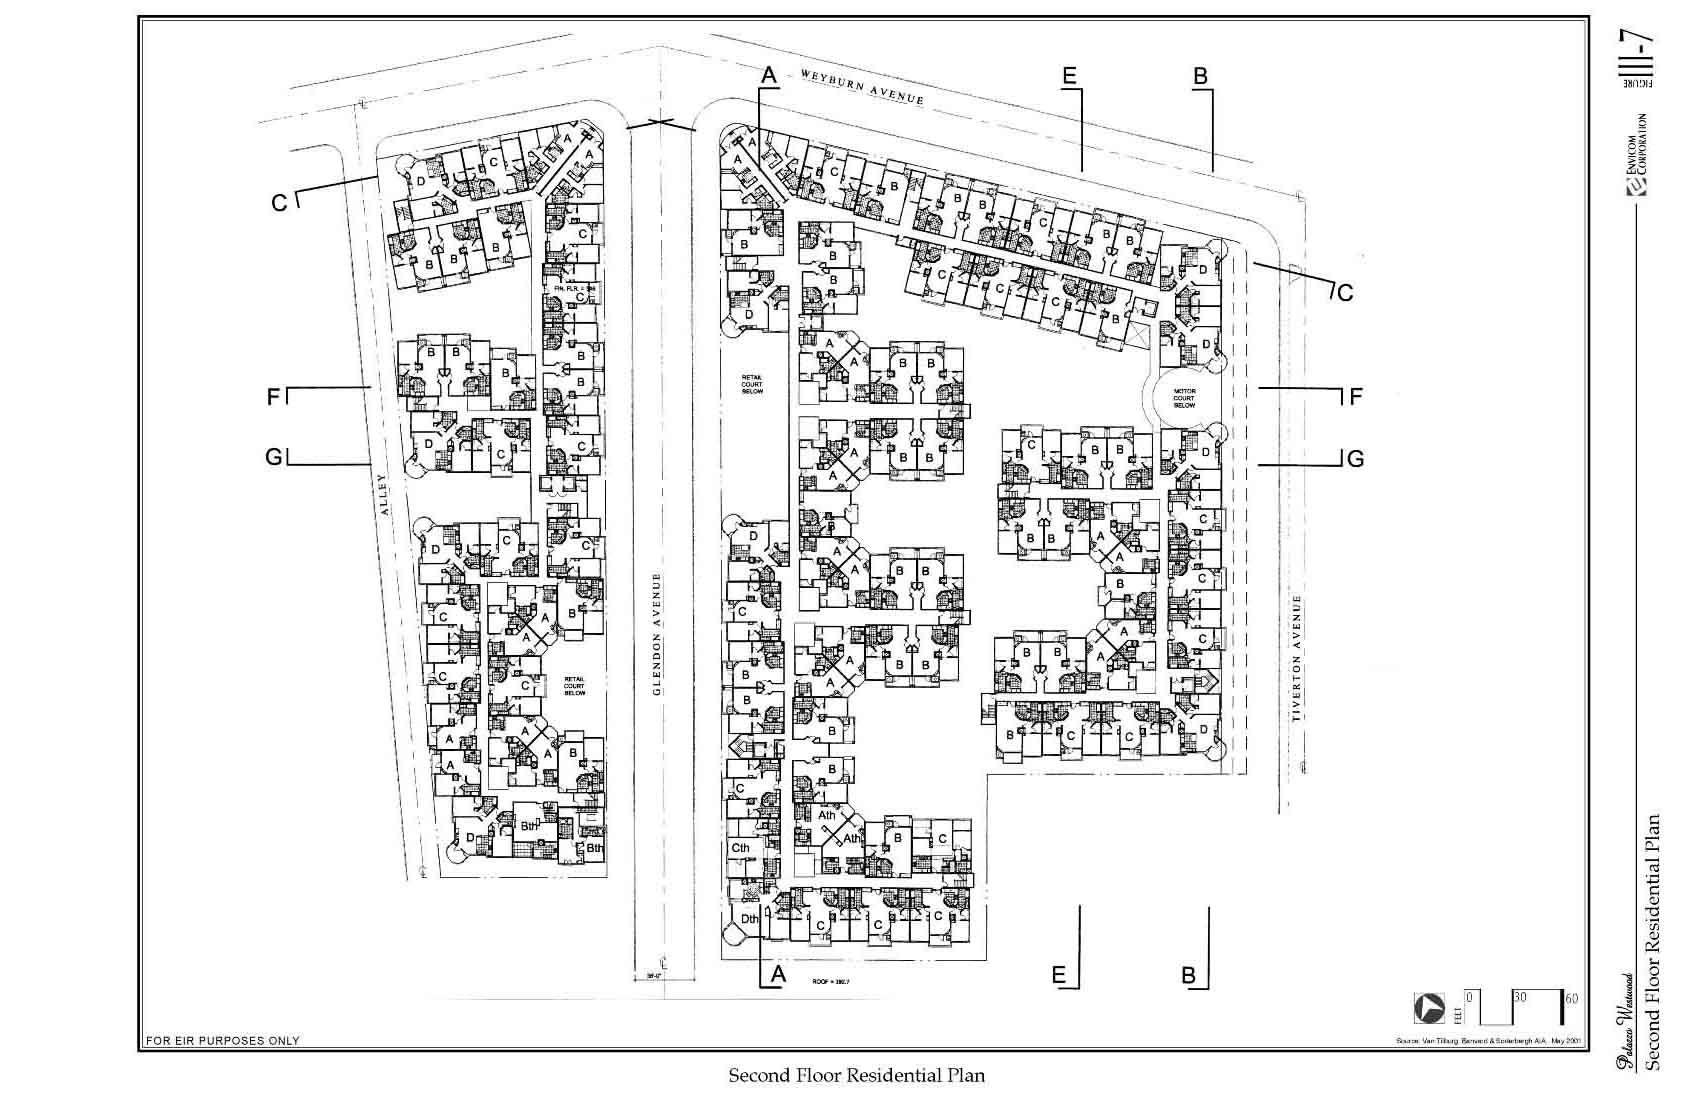
Figure III-7 Second Floor Residential Plan (162k)
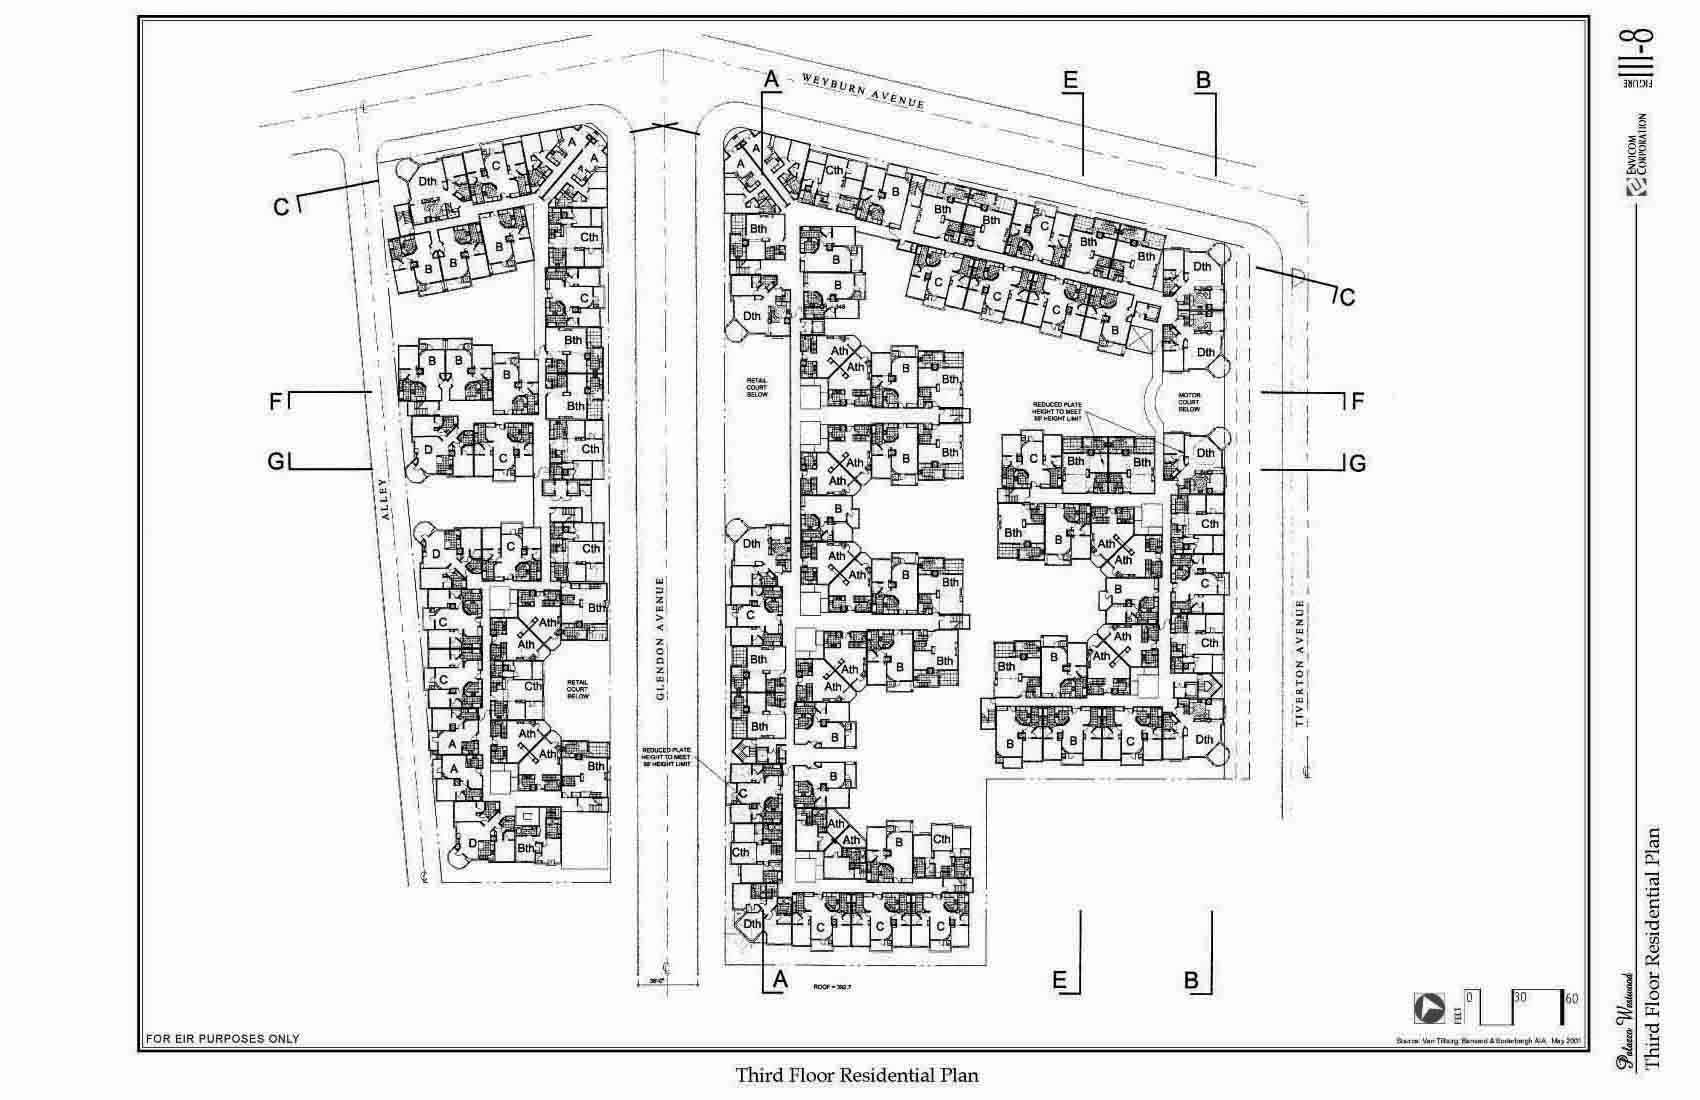
Figure III-8 Third Floor Residential Plan (276k)
Figure III-9 Fourth Floor Residential Plan (171k)
Figure III-10 Roof Plan (101k)
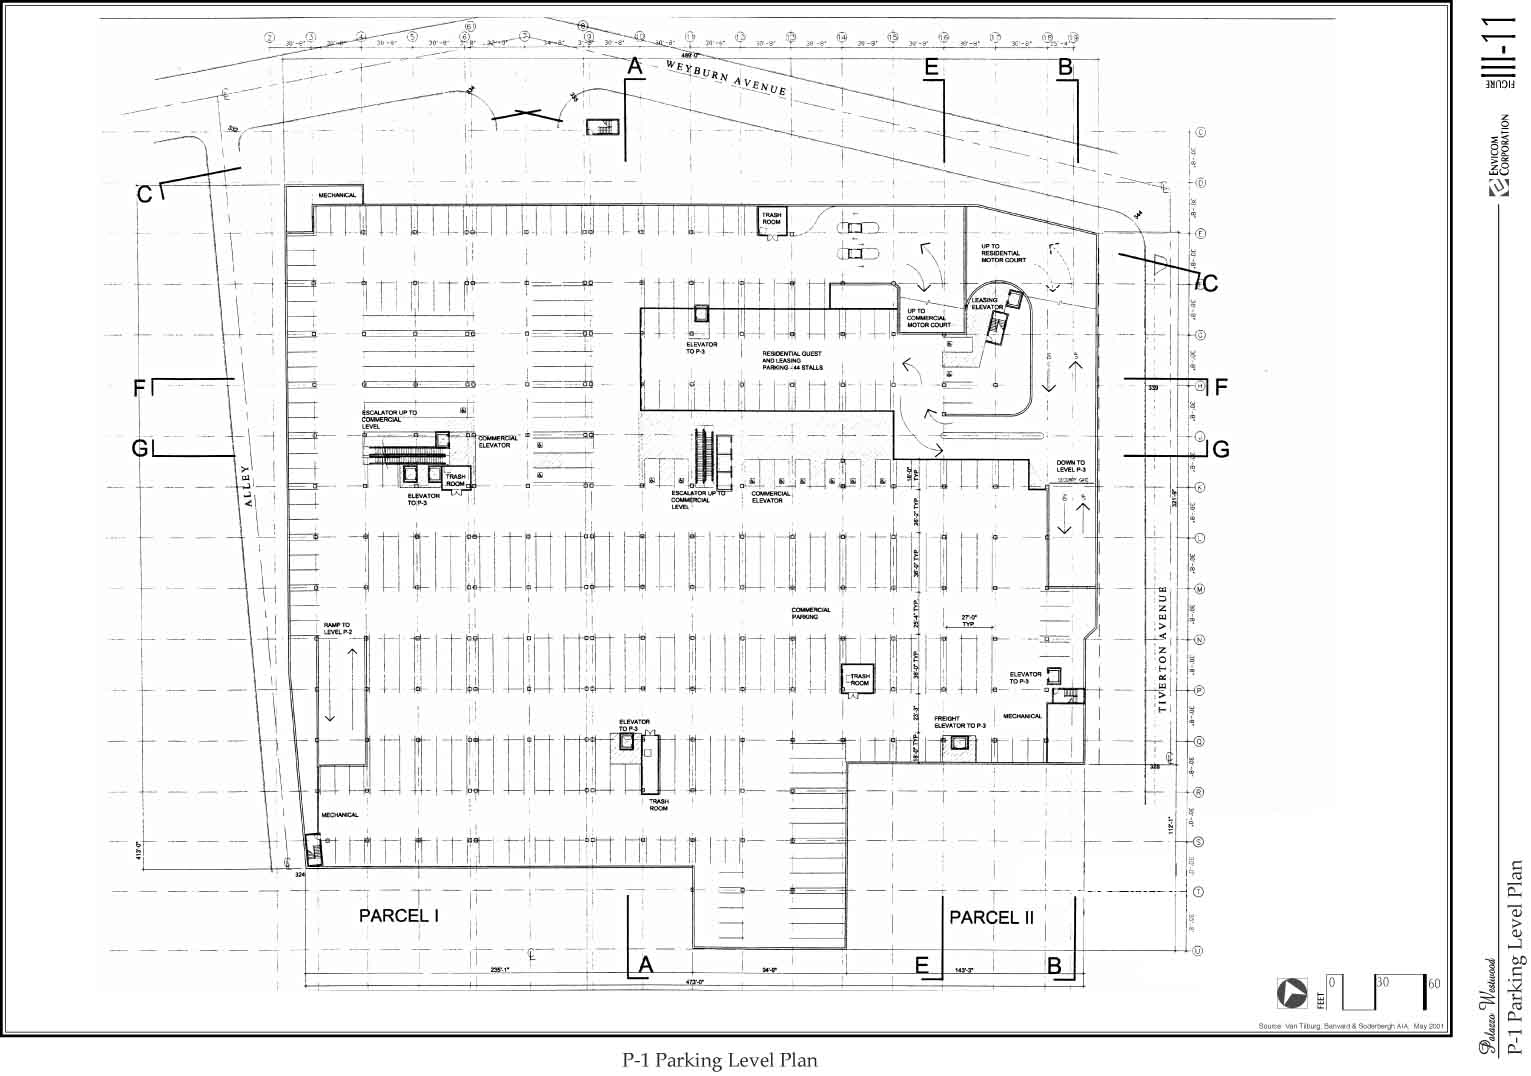
Figure III-11 P-1 Level Parking Plan (139k)
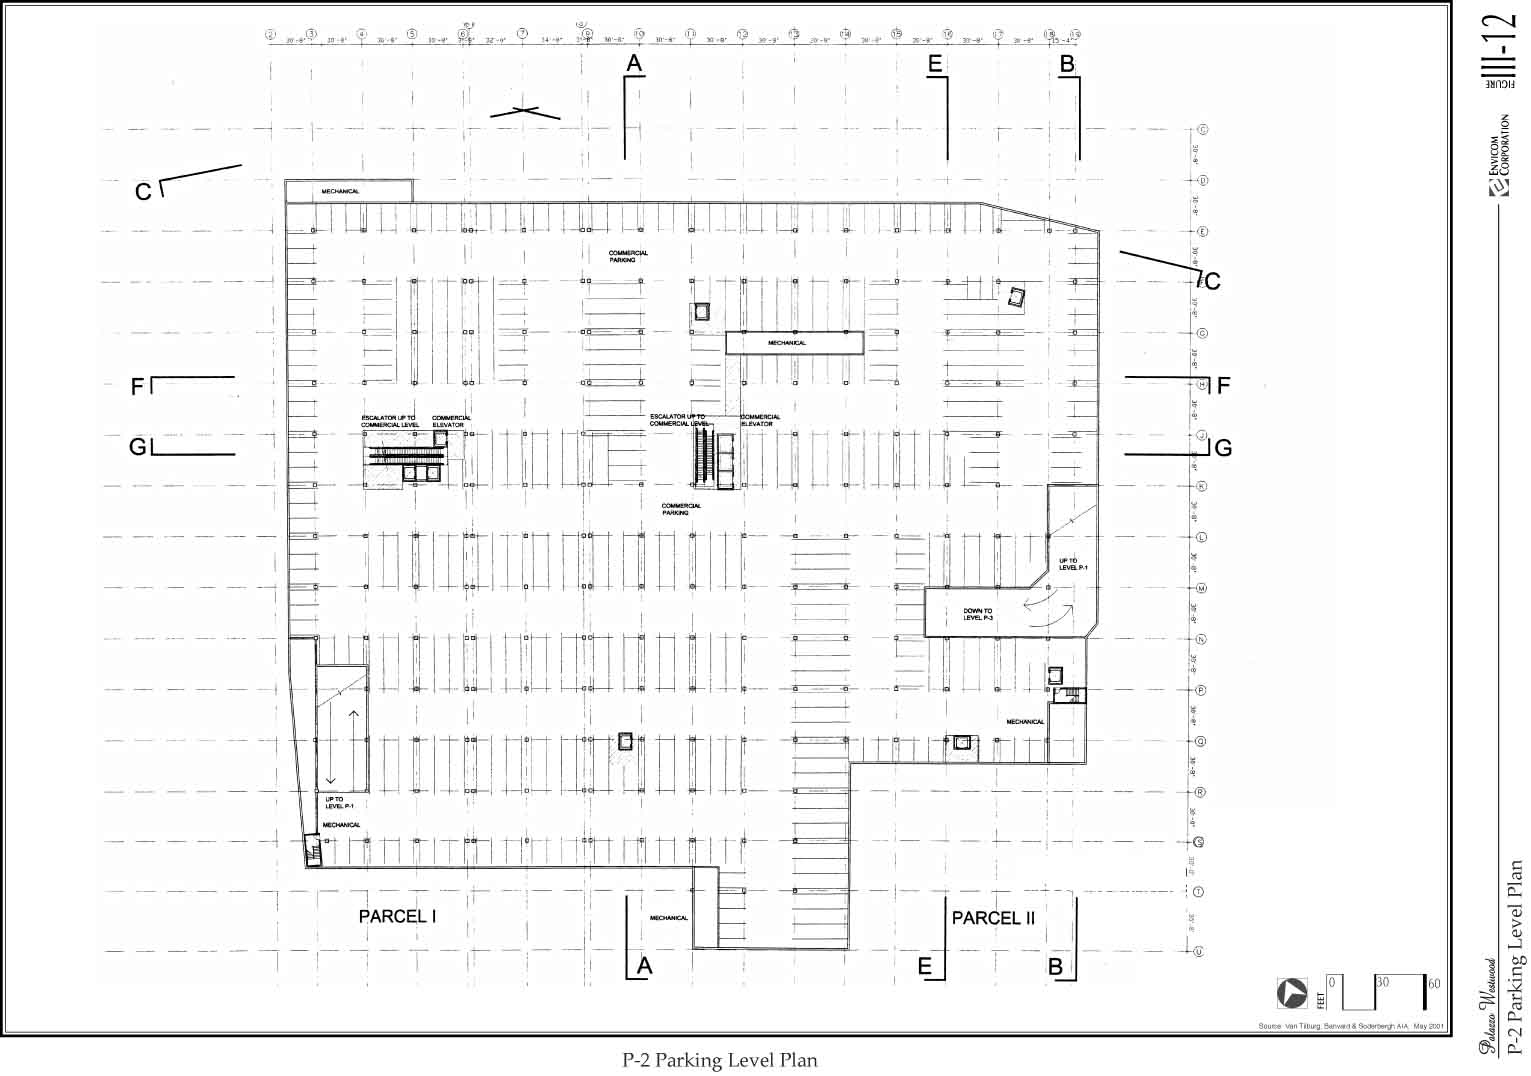
Figure III-12 P-2 Level Parking Plan (117k)
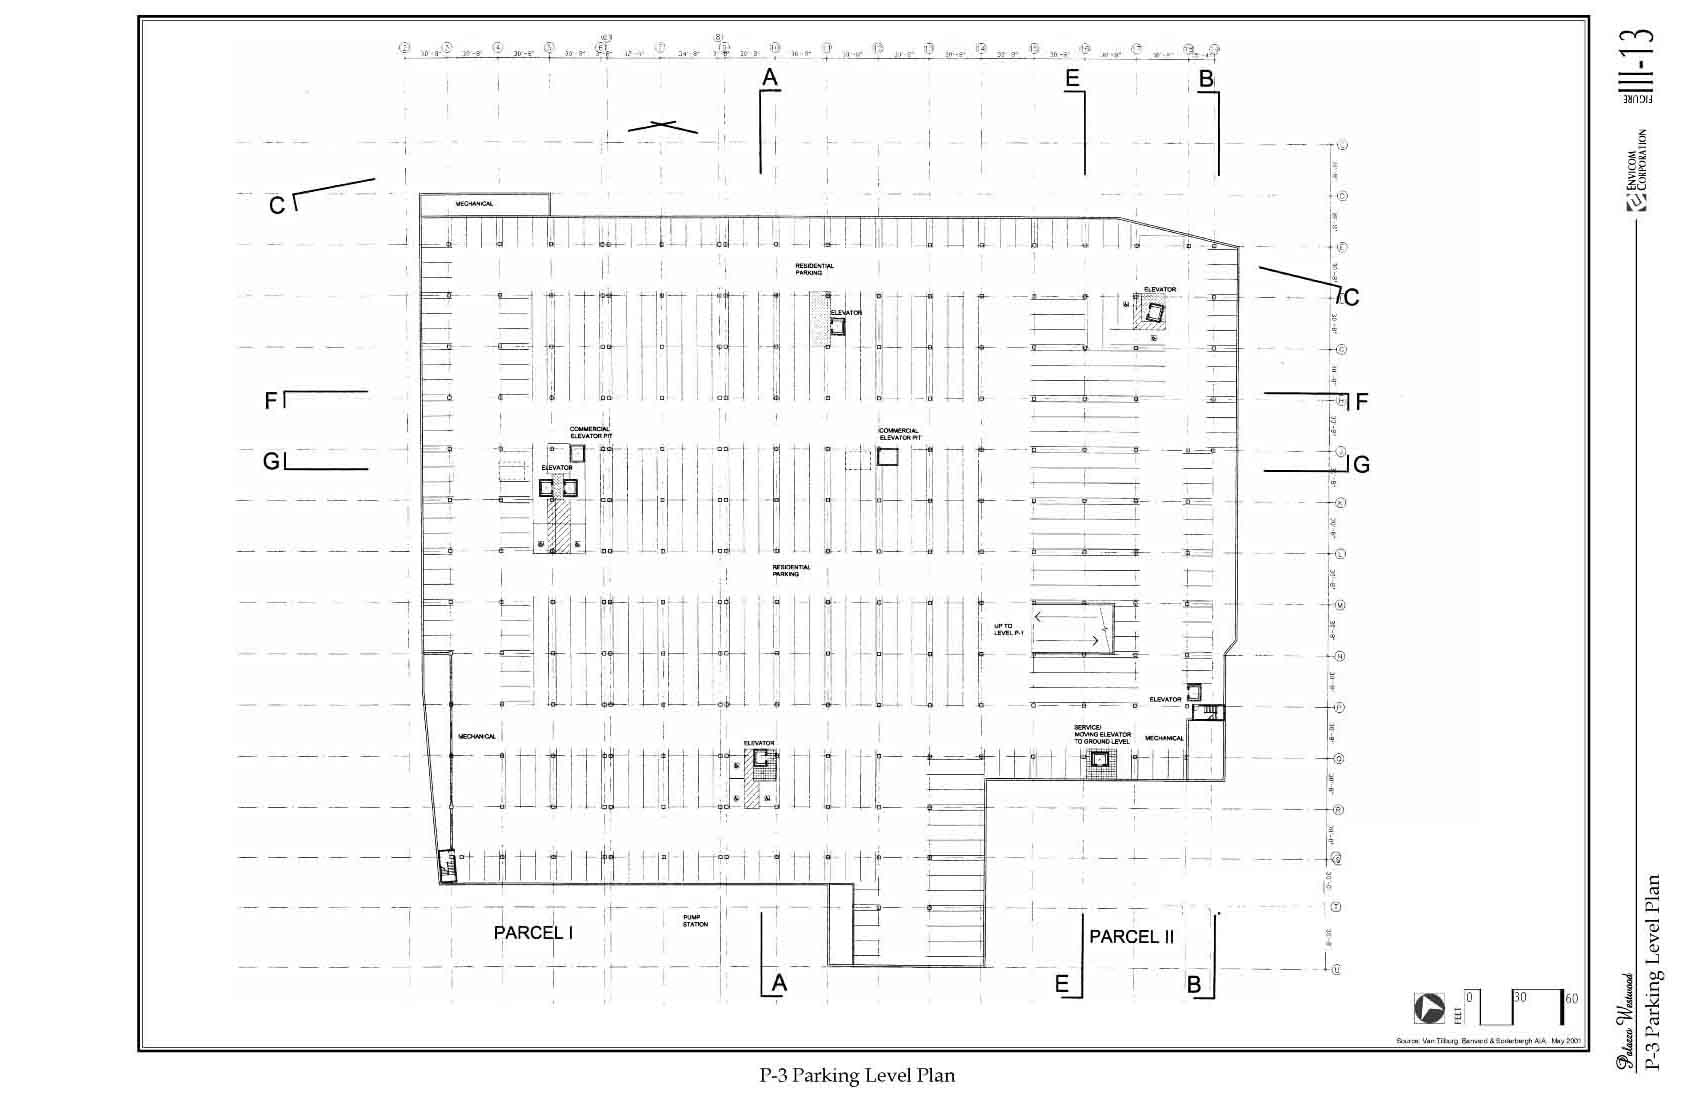
Figure III-13 P-3 Level Parking Plan (94k)
Figure III-14 Project Elevations Glendon Avenue Looking East and West (96k)
Figure III-15 Project Elevations, Tiverton Avenue Lookng West and Weyburn Avenue Looking South (114k)
Figure III-16 Project Cross Sections (A-A, B-B and C-C) (128k)
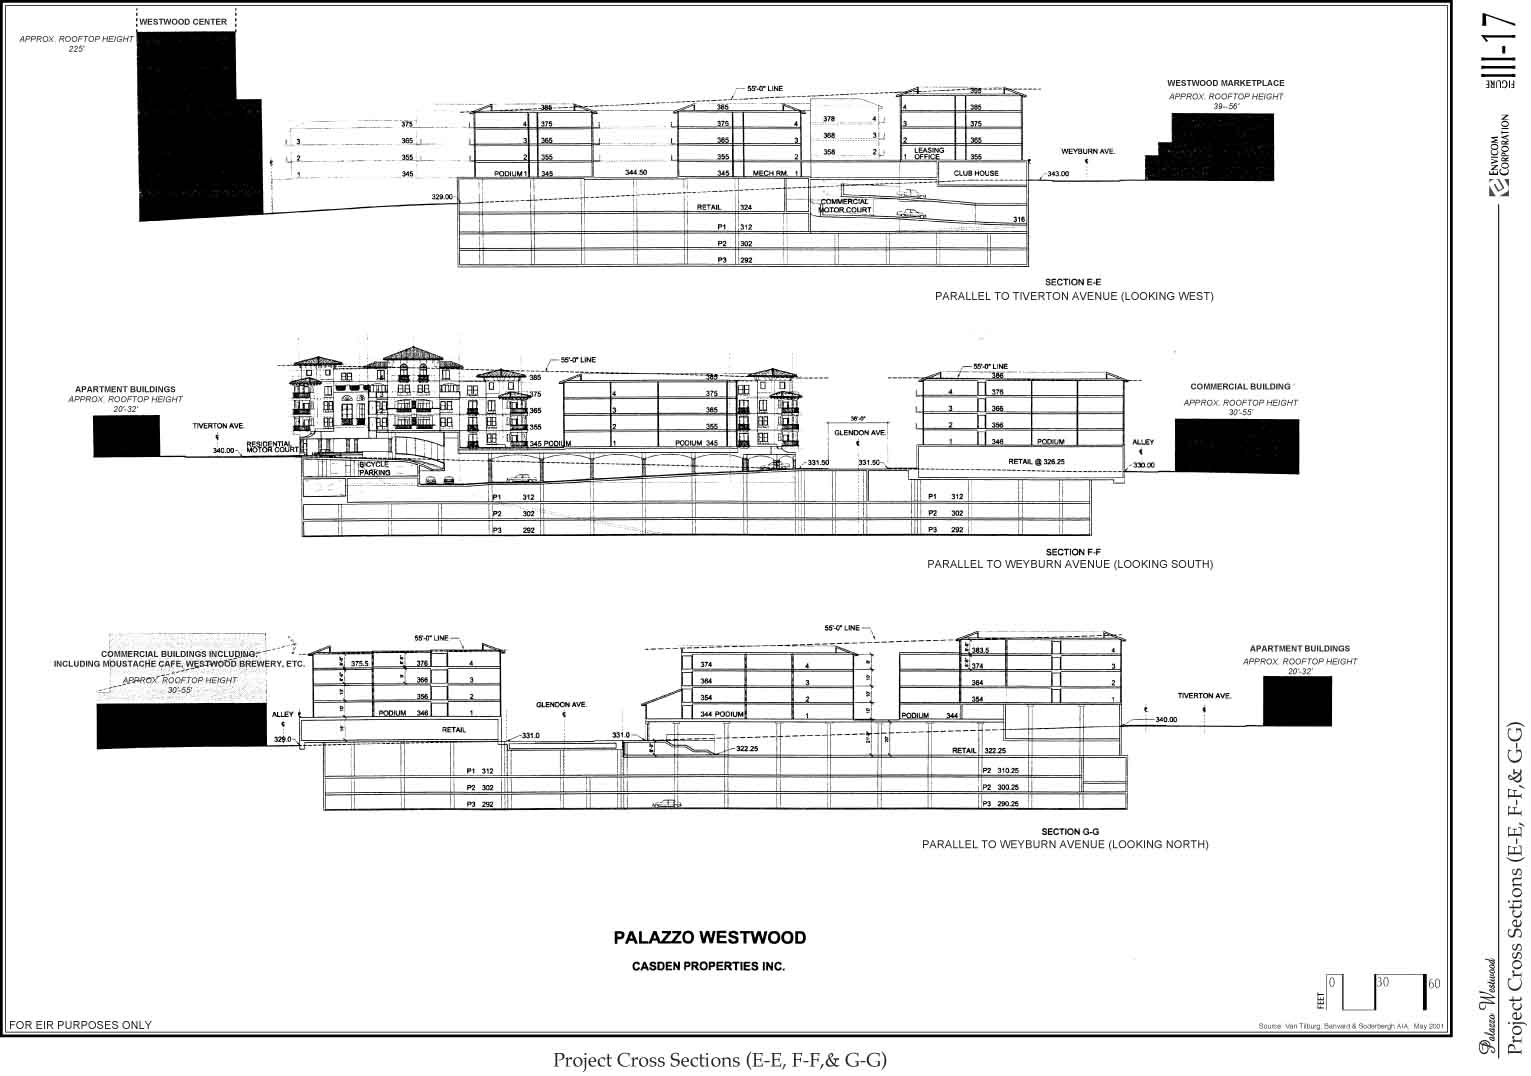
Figure III-17 Project Cross Sections (E-E, F-F and G-G) (138k)
Figure III-18 Project Cross Sections (G-G Continued) (118k)
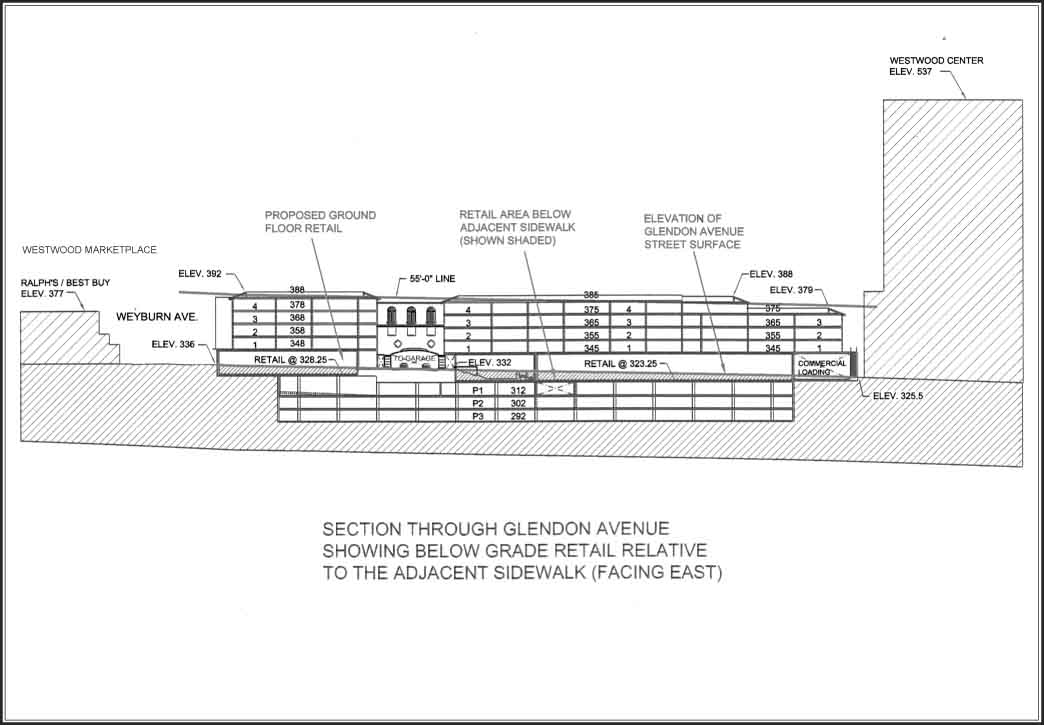
Figure III-19 Location of Ground Floor/Retail Space/Below Grade Cross Section (76k)
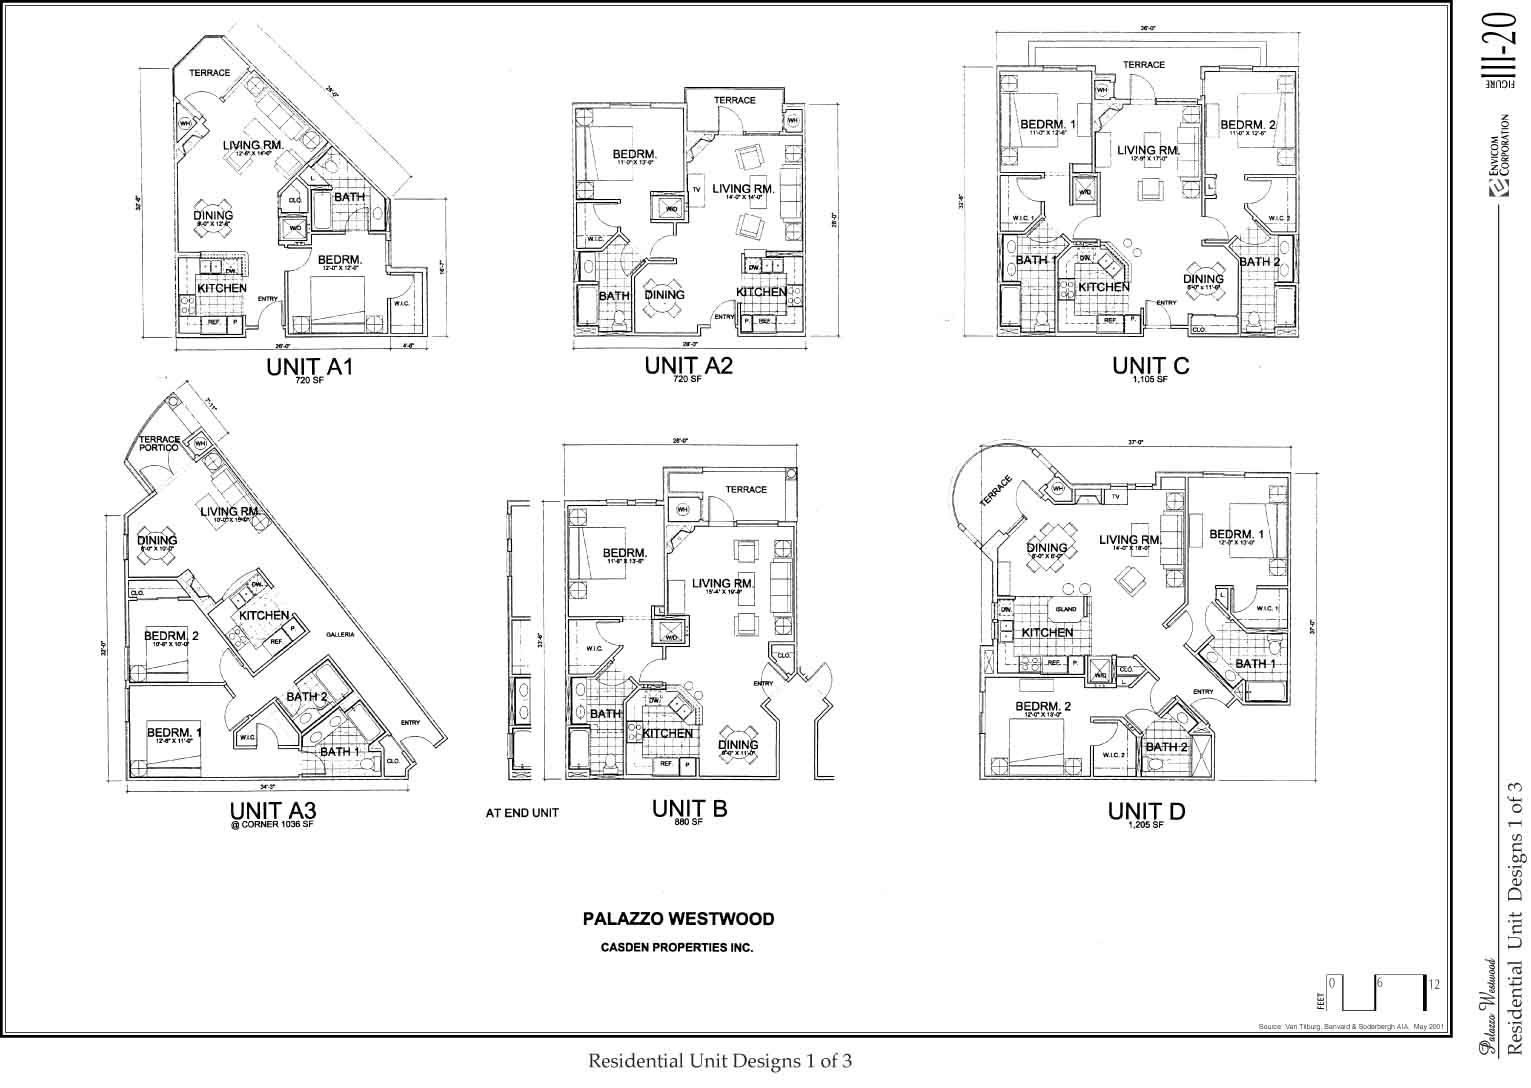
Figure III-20 Residential Unit Designs (1 of 3) (144k)
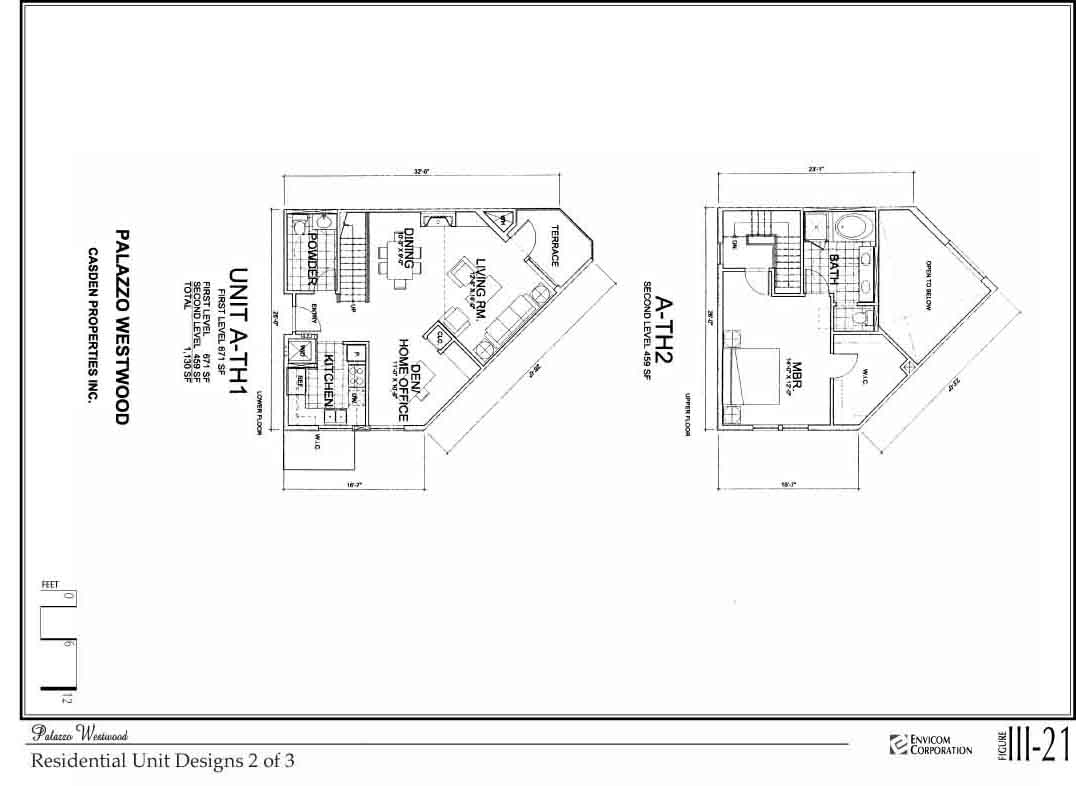
Figure III-21 Residential Unit Designs (2 of 3) (48k)
Figure III-22 Residential Unit Designs (3 of 3) (149k)
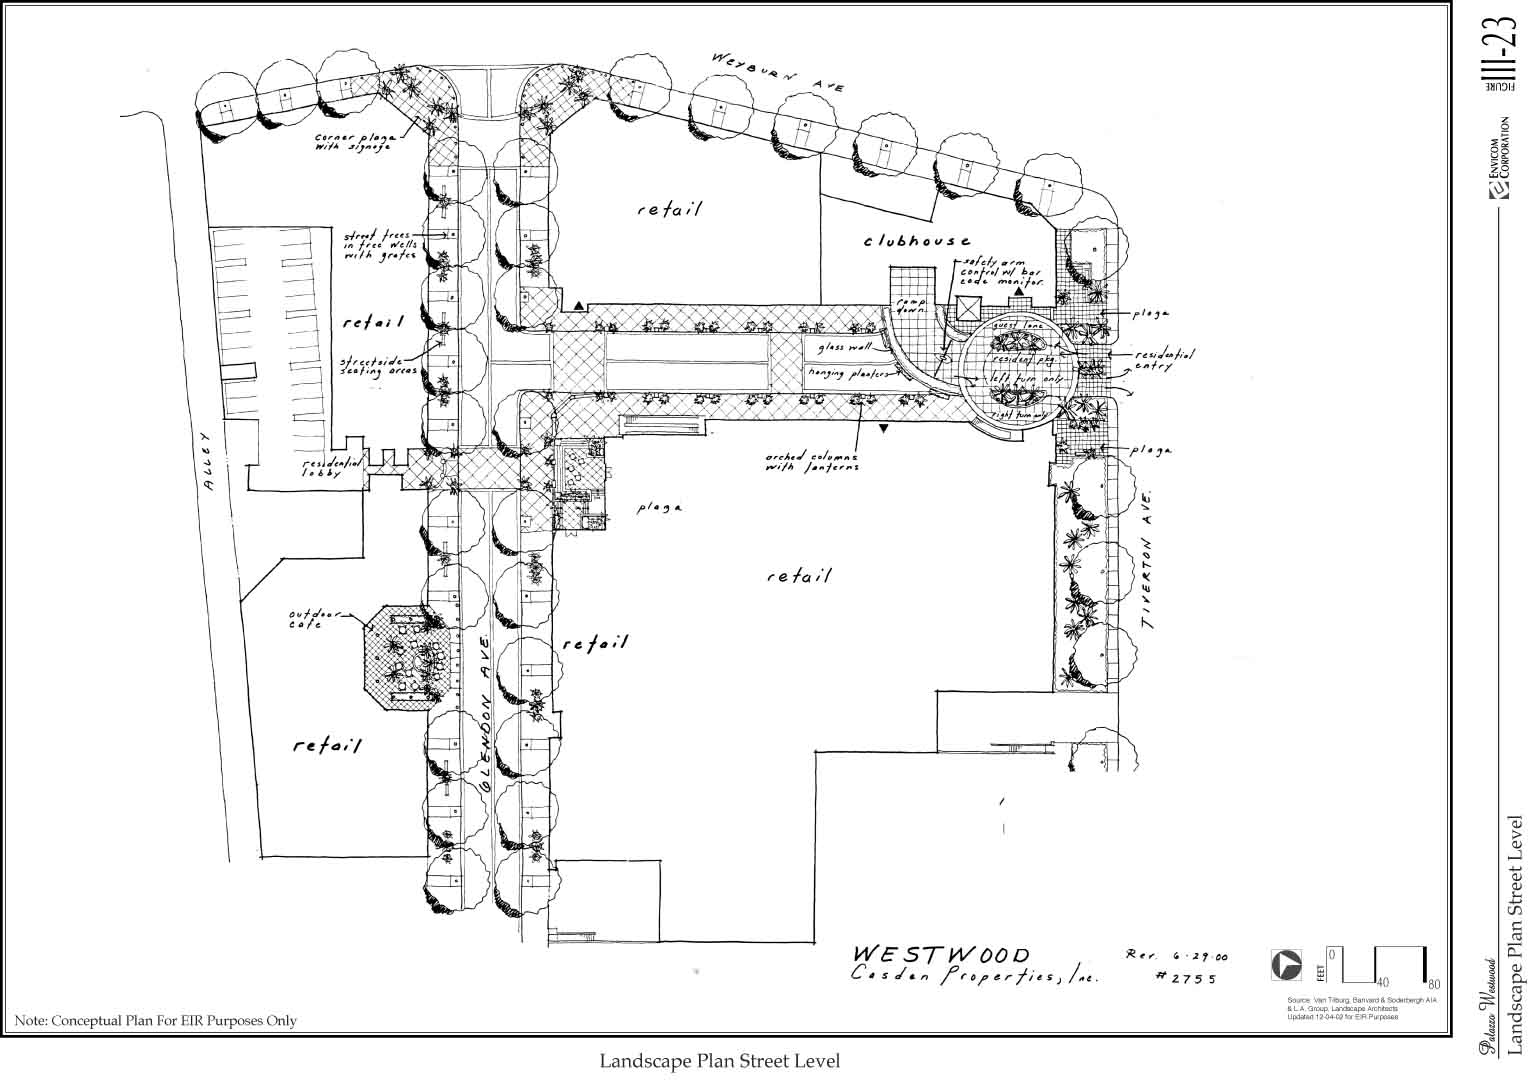
Figure III-23 Landscape Plan Street Level (145k)
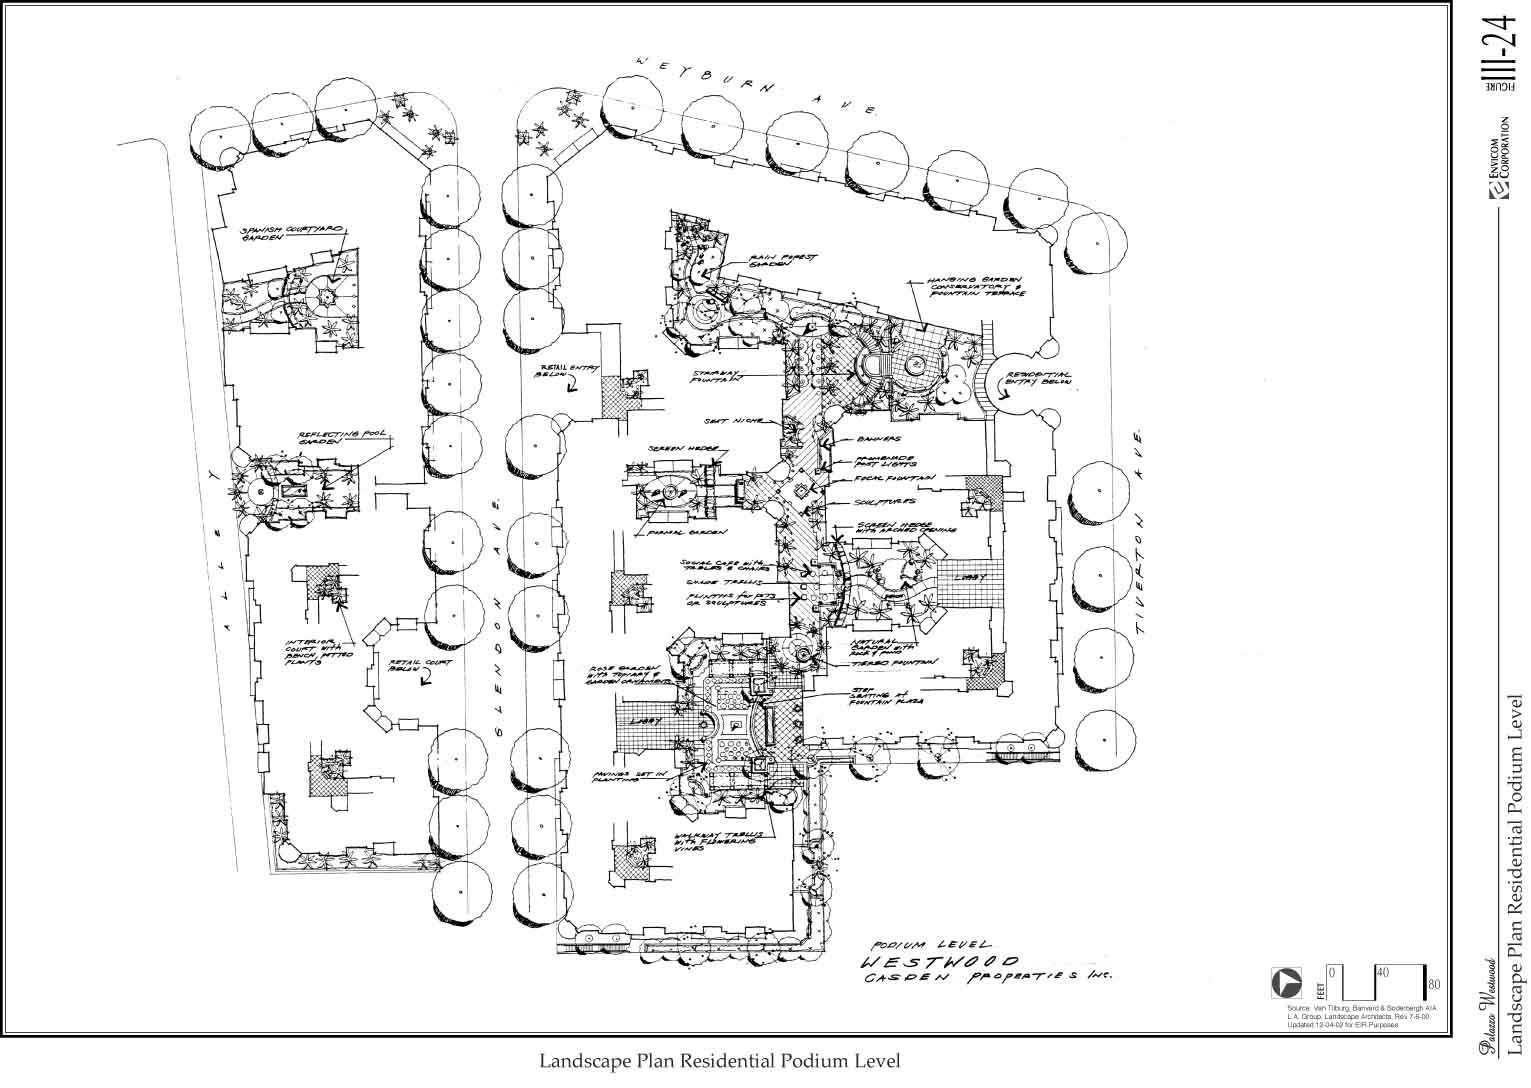
Figure III-24 Landscape Plan Residential Podium Level (168k)
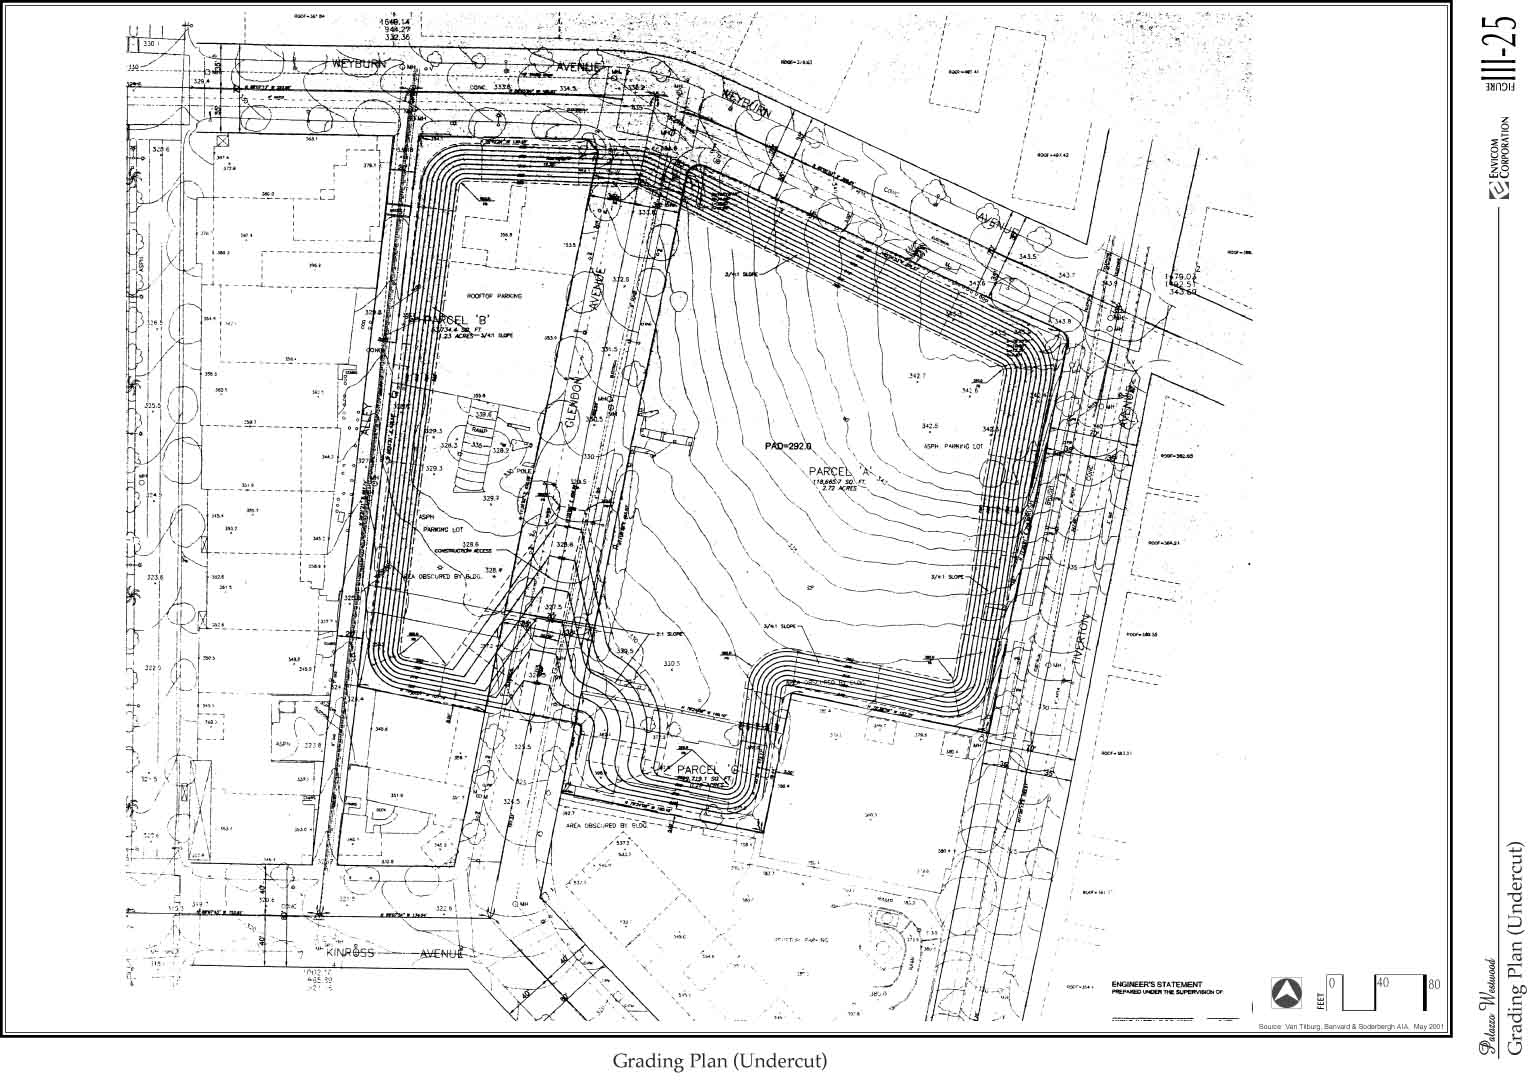
Figure III-25 Grading Plan (Undercut) (235k)
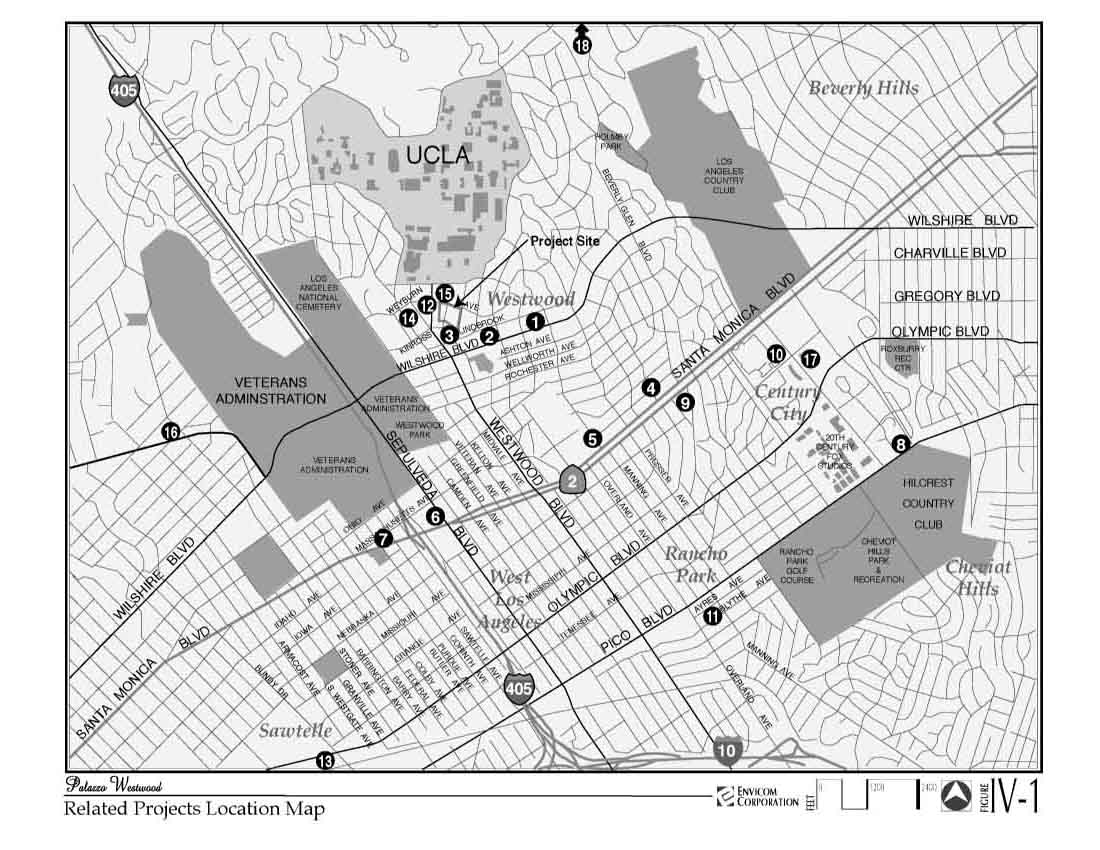
Figure IV-1 Related Projects Location Map (119k)
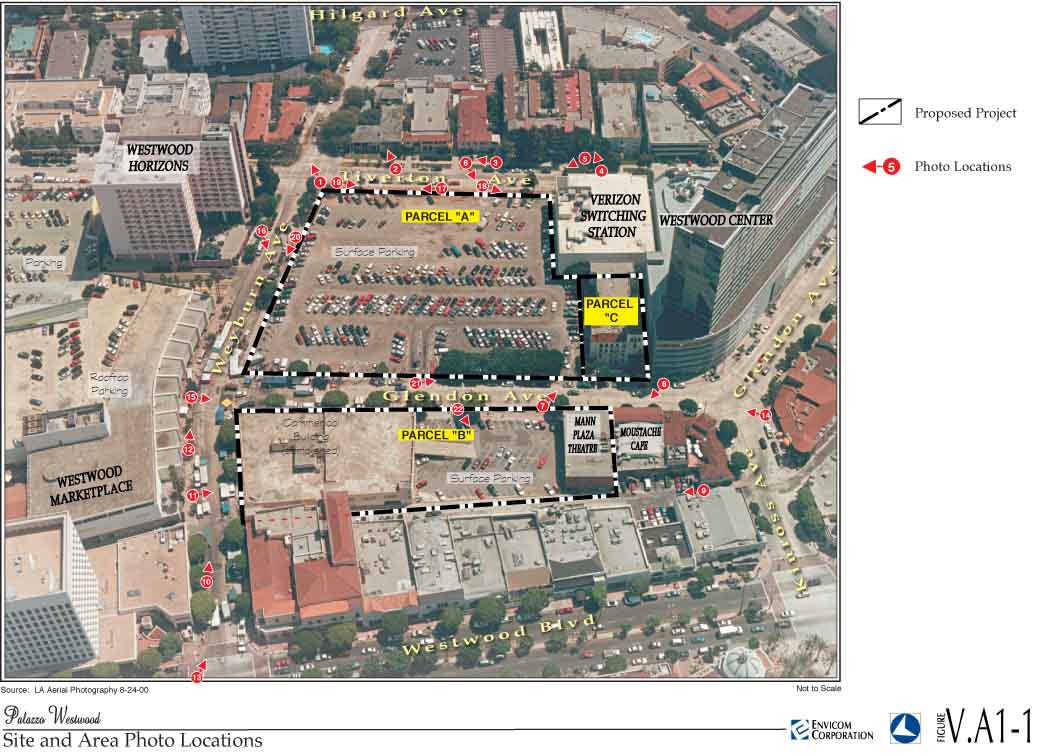
Figure V.A1-1 Site and Area Photo Locations (130k)
Figure V.A1-2 Site and Area Photos 1-4 (111k)
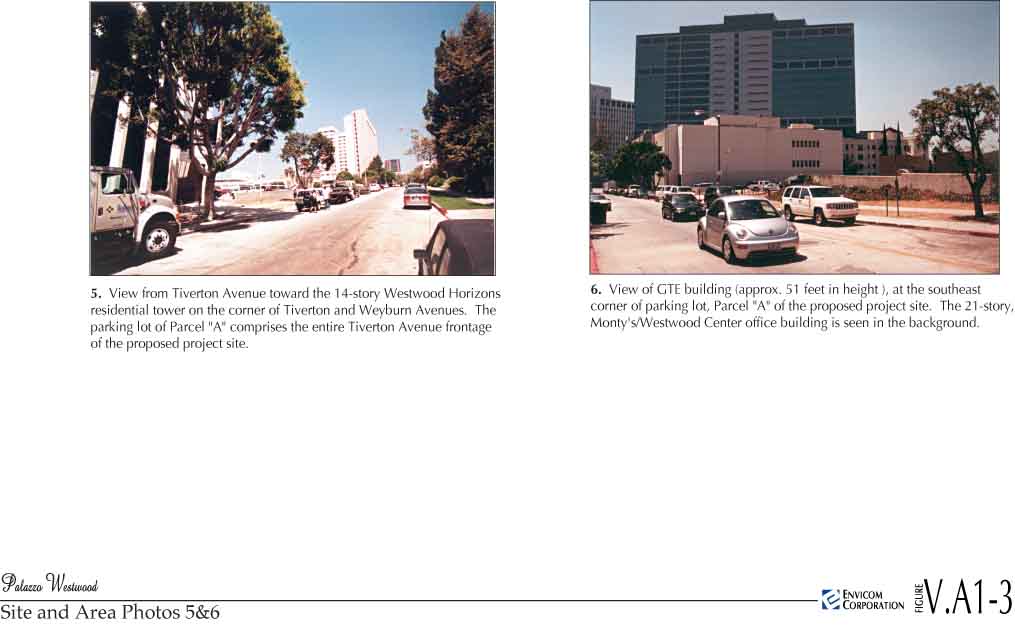
Figure V.A1-3 Site and Area Photos 5 & 6 (79k)
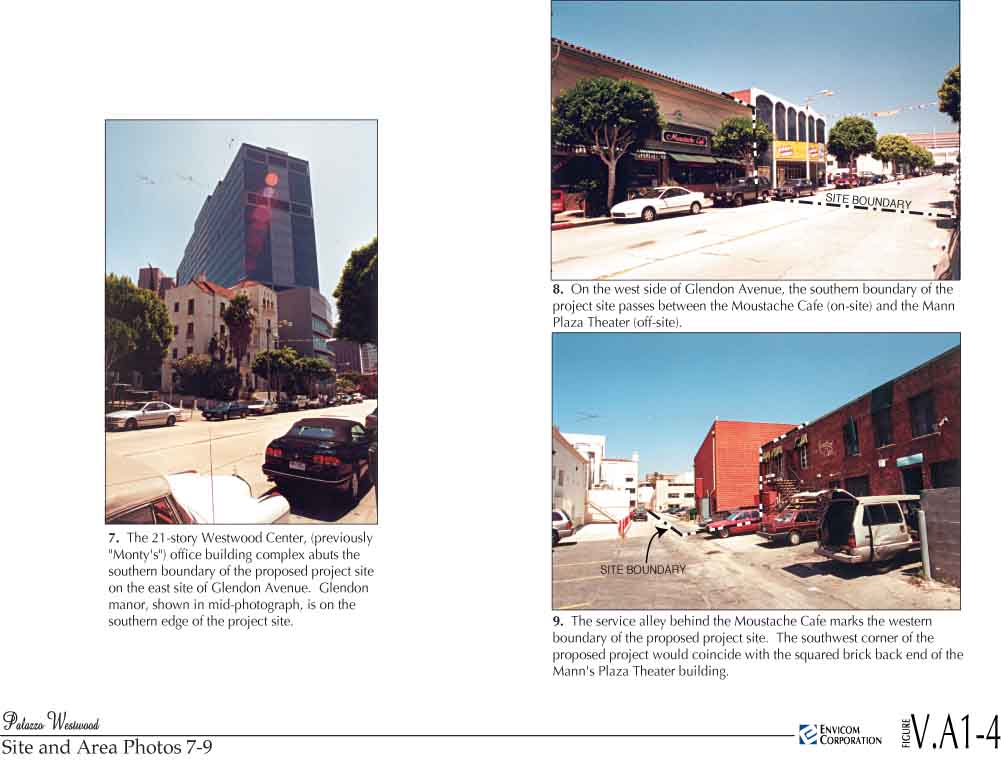
Figure V.A1-4 Site and Area Photos 7-9 (98k)
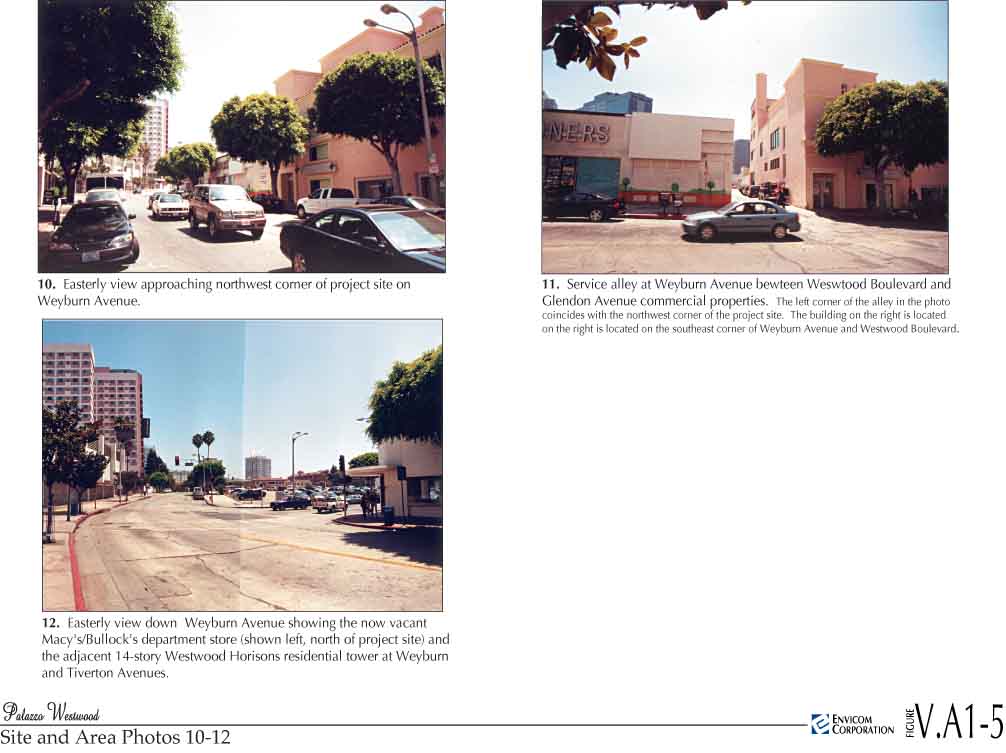
Figure V.A1-5 Site and Area Photos 10-12 (96k)
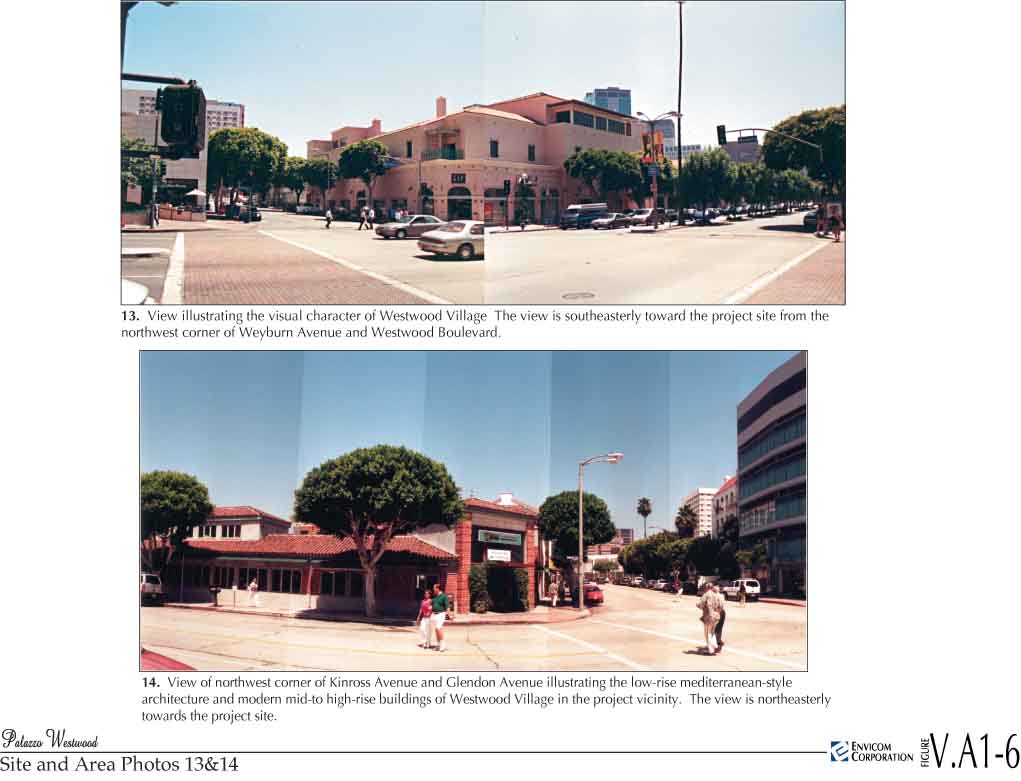
Figure V.A1-6 Site and Area Photos 13 &14 (92k)
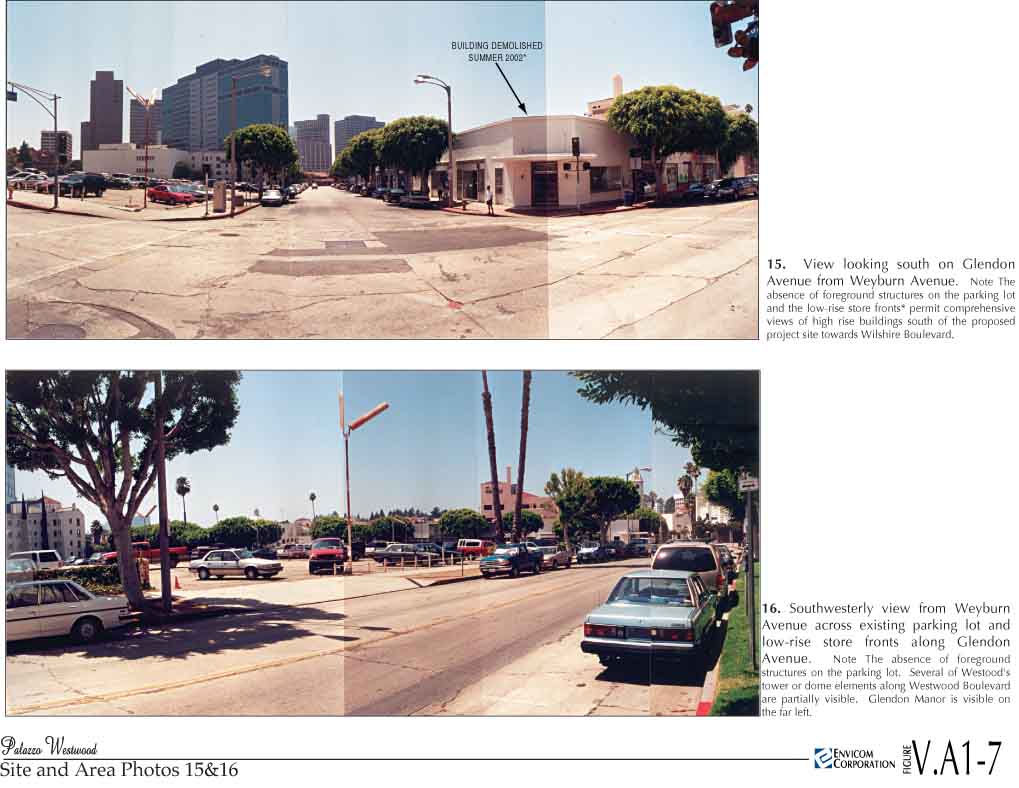
Figure V.A1-7 Site and Area Photos 15 & 16 (111k)
Figure V.A1-8 Site and Area Photos 17-19 (104k)
Figure V.A1-9 Site and Area Photos 20-22 (91k)
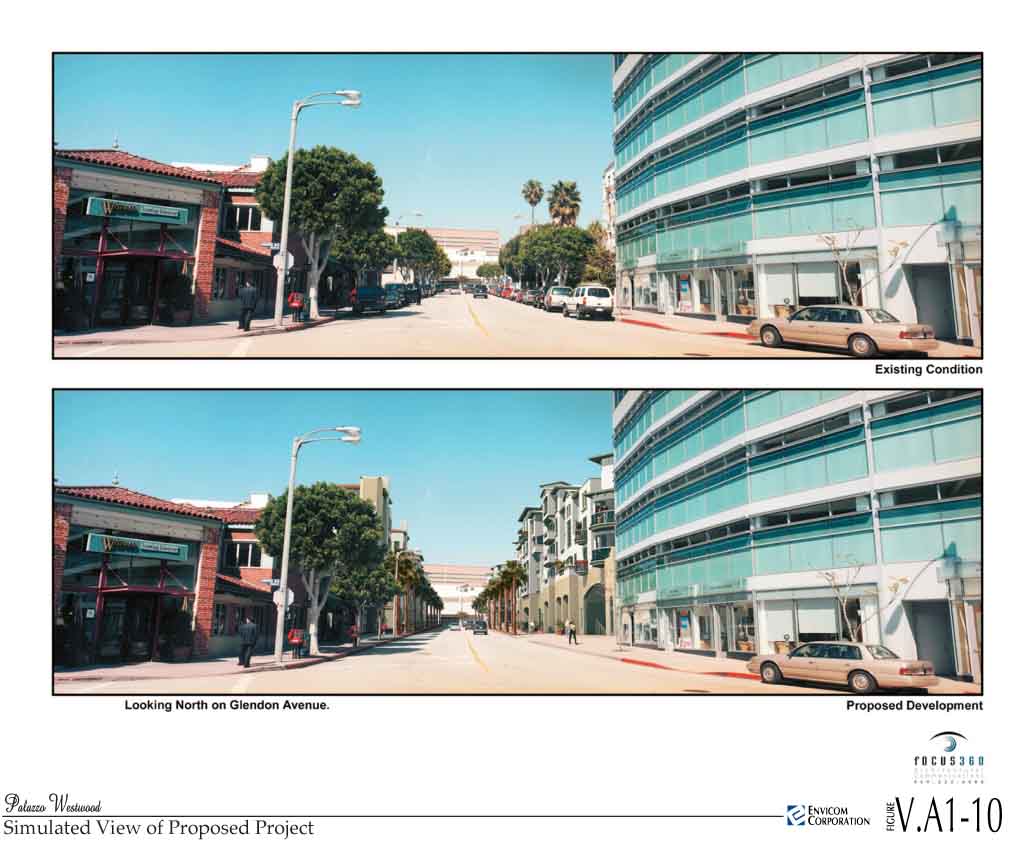
Figure V.A1-10 Simulated View of Proposed Project (Looking North on Glendon Ave) (111k)
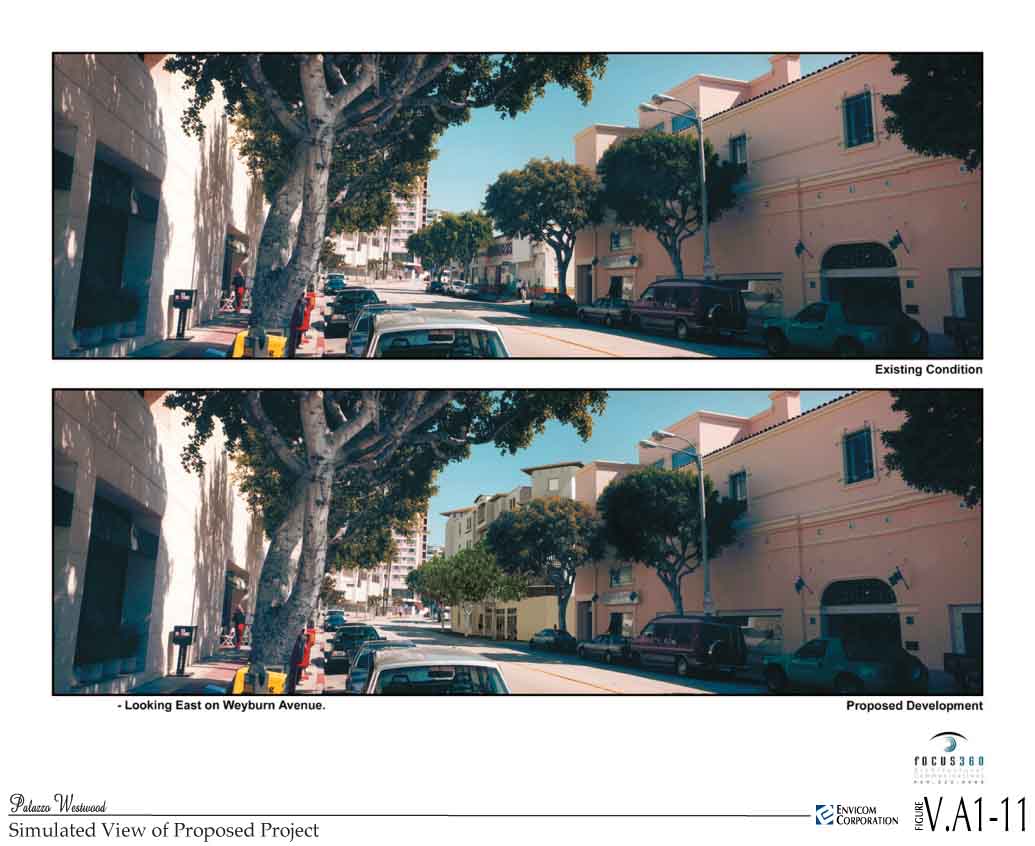
Figure V.A1-11 Simulated View of Proposed Project (Looking East on Weyburn Ave) (109k)
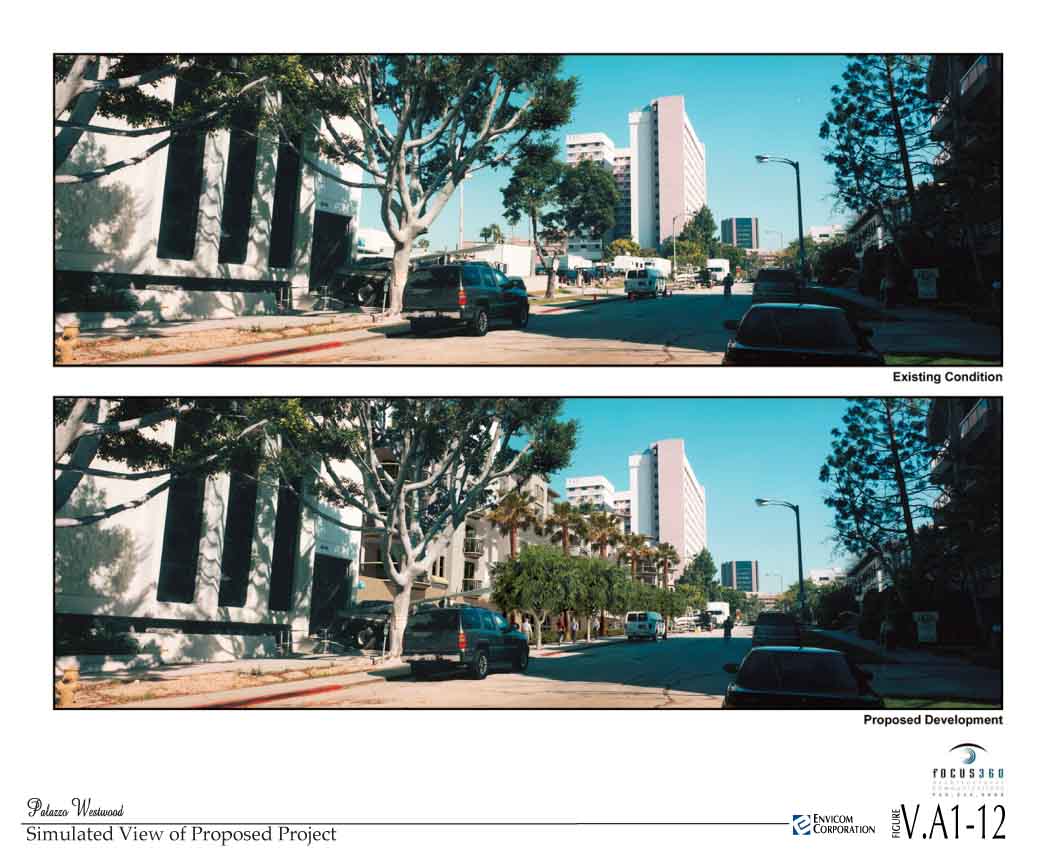
Figure V.A1-12 Simulated View of Proposed Project (Looking Northerly on Tiverton Ave) (125k)
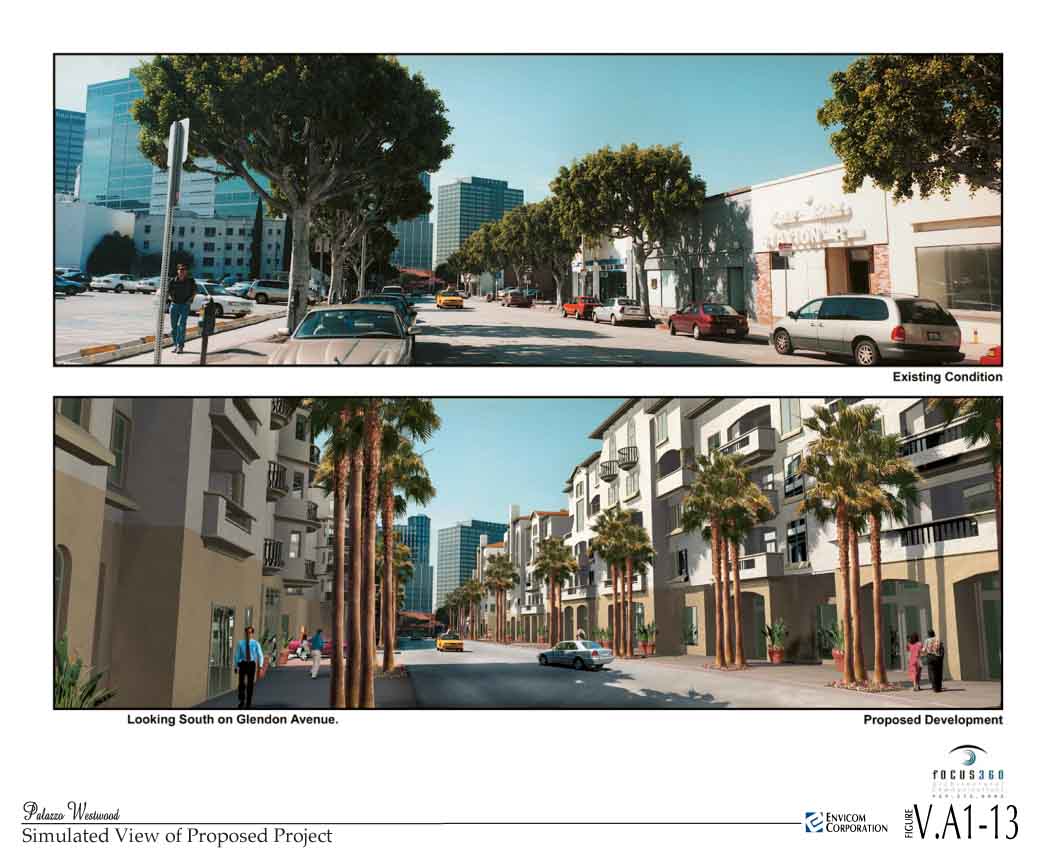
Figure V.A1-13 Simulated View of Proposed Project (Looking South on Glendon Ave) (120k)
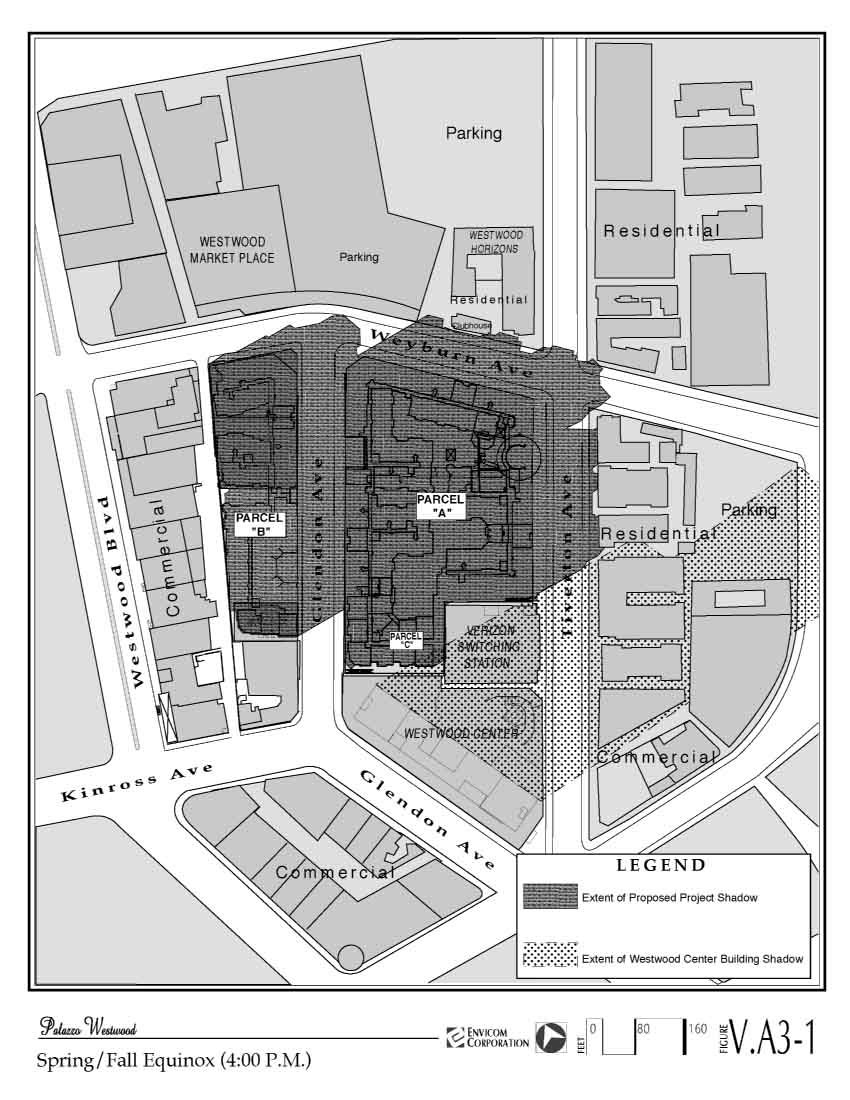
Figure V.A3-1 Spring/Summer Solstice (4:00 P.M.) (139k)
Figure V.A3-2 Winter Solstice (2:00 P.M.) (130k)
Figure V.A3-3 Winter Solstice (3:00 P.M.) (147k)
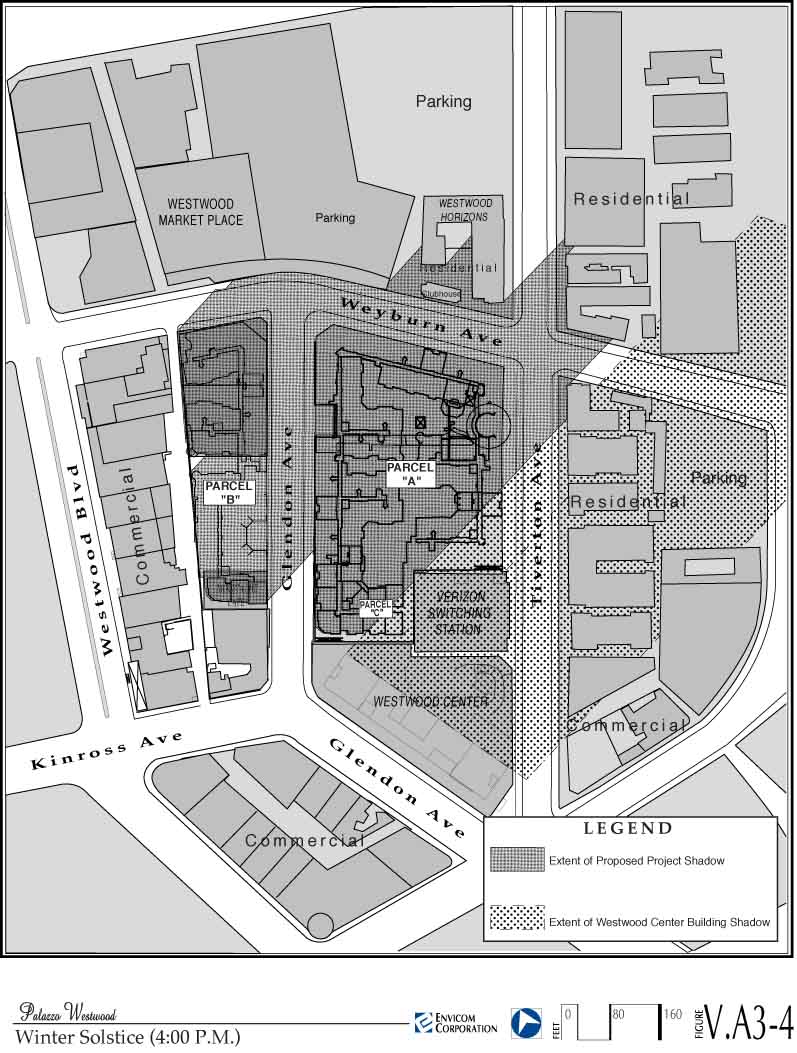
Figure V.A3-4 Winter Solstice (4:00 P.M.) (152k)
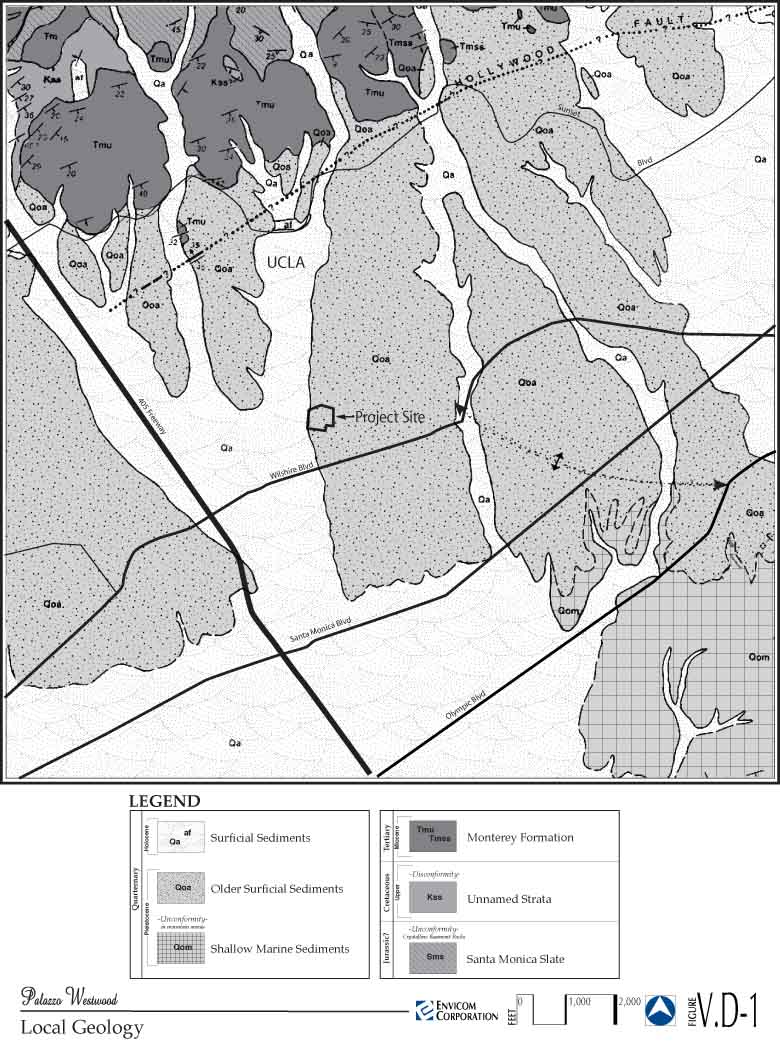
Figure V.D-1 Local Geology (154k)
Figure V.D-2 Fault Map (84k)
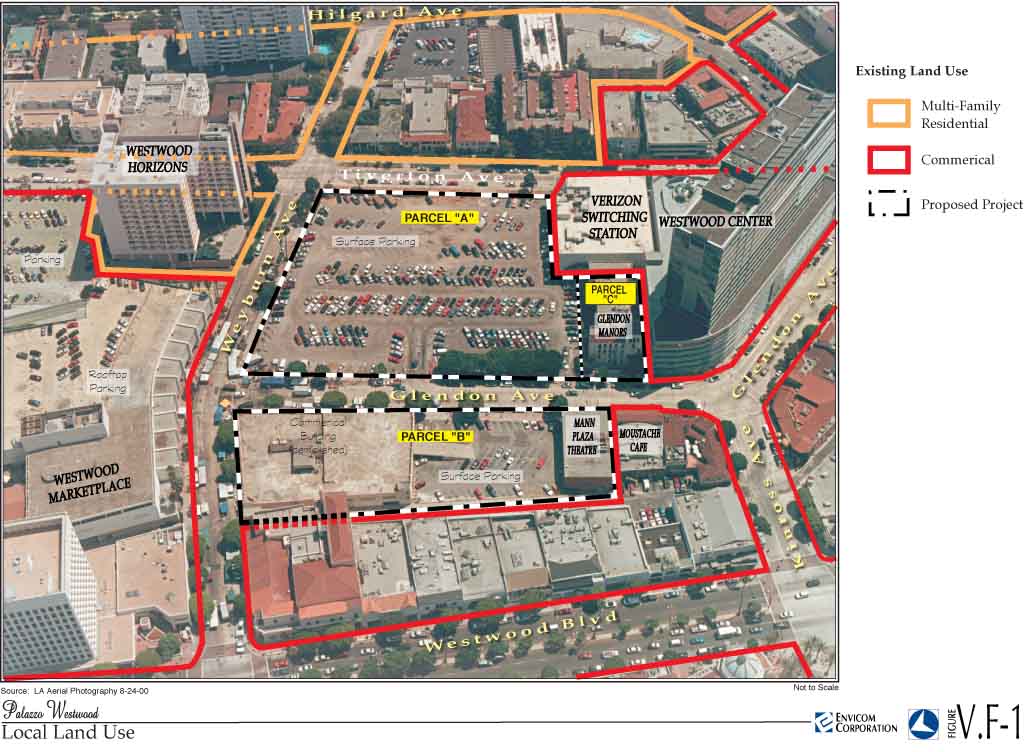
Figure V.F-1 Local Land Use (135k)
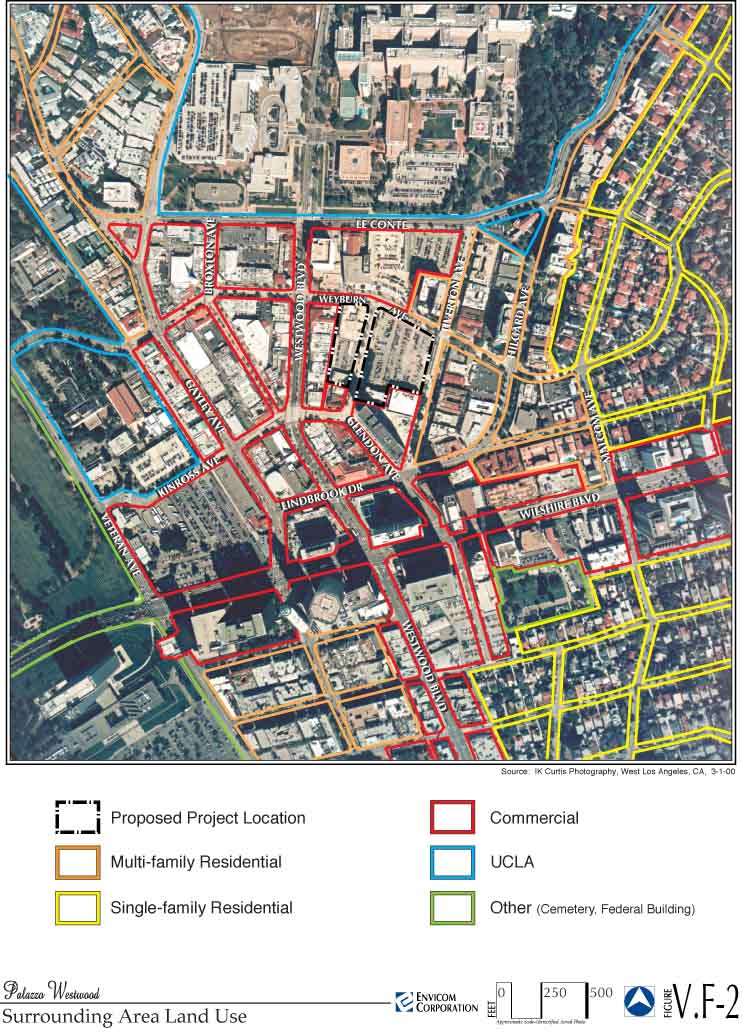
Figure V.F-2 Surrounding Area Land Use (173k)
Figure V.F-3 Westwood Village Specific Plan (99k)
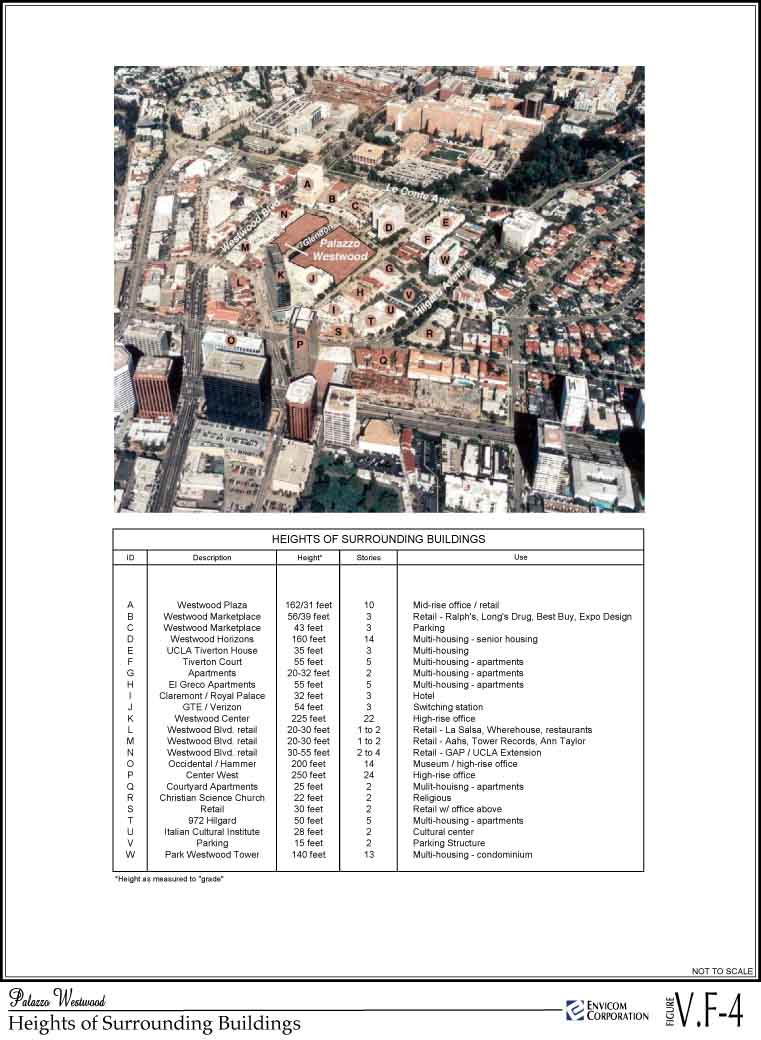
Figure V.F-4 Heights of Surrounding Buildings (123k)
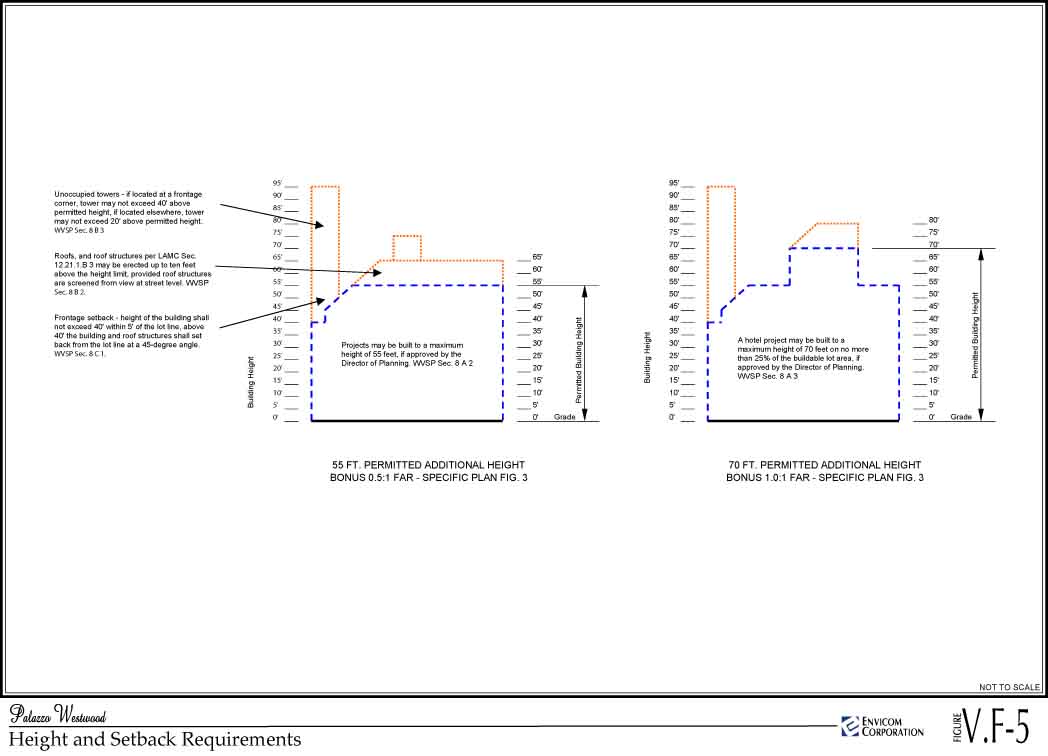
Figure V.F-5 Heights and Setback Requirements (74k)
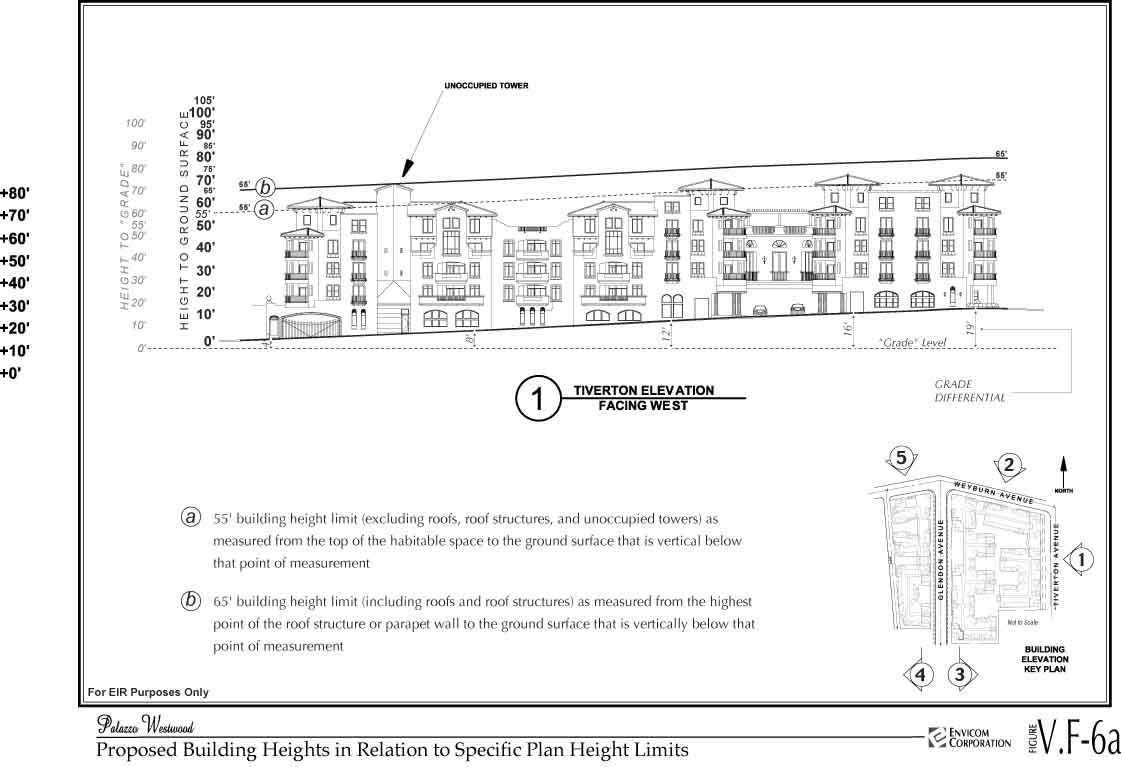
Figure V.F-6a Proposed Building Height in Relation to Specific Plan Height Limits (95k)
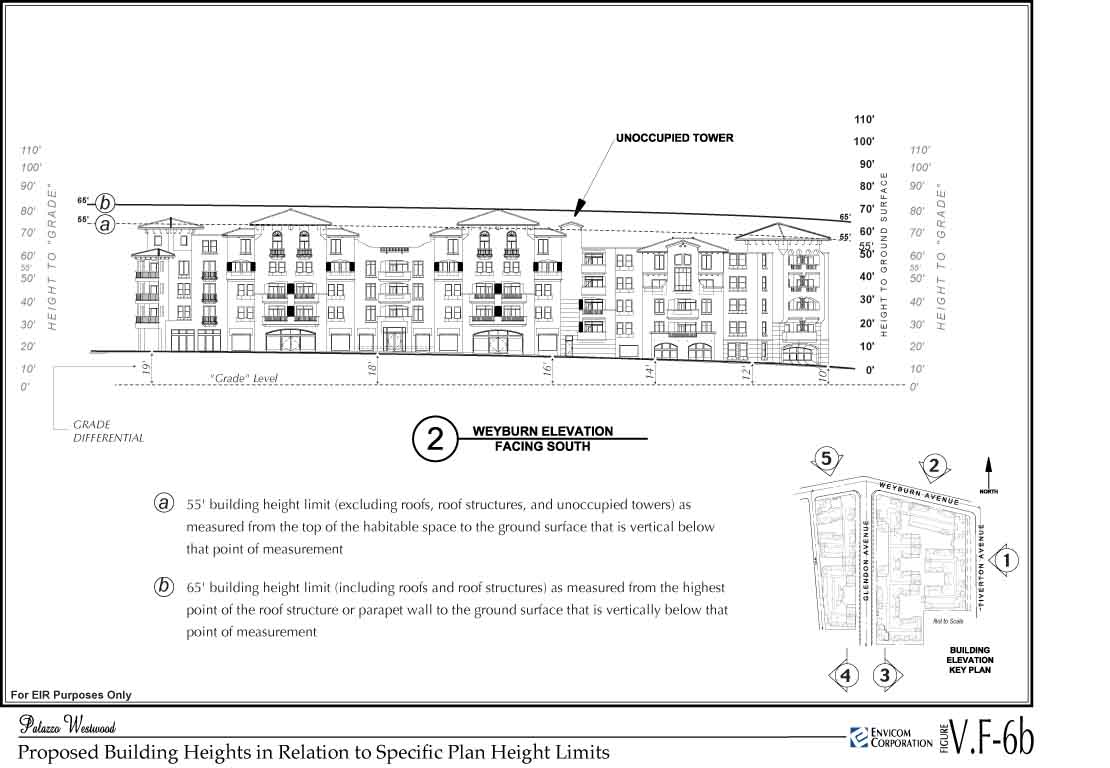
Figure V.F-6b Proposed Building Height in Relation to Specific Plan Height Limits (98k)
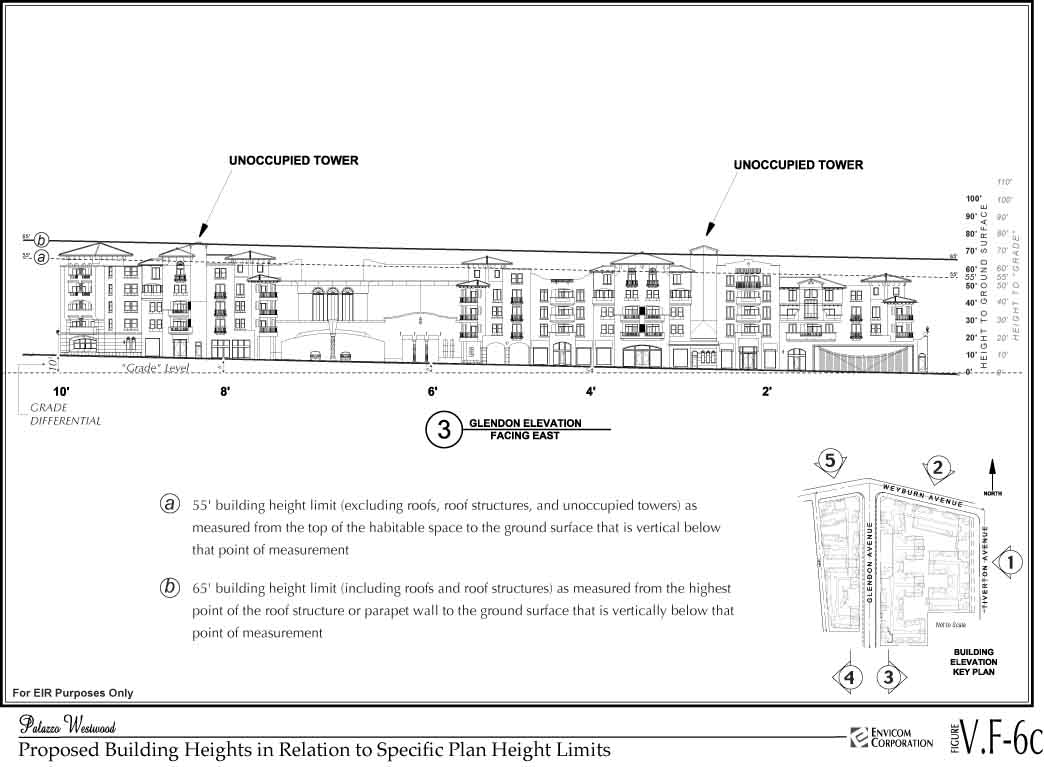
Figure V.F-6c Proposed Building Height in Relation to Specific Plan Height Limits (92k)
Figure V.F-6d Proposed Building Height in Relation to Specific Plan Height Limits (96k)
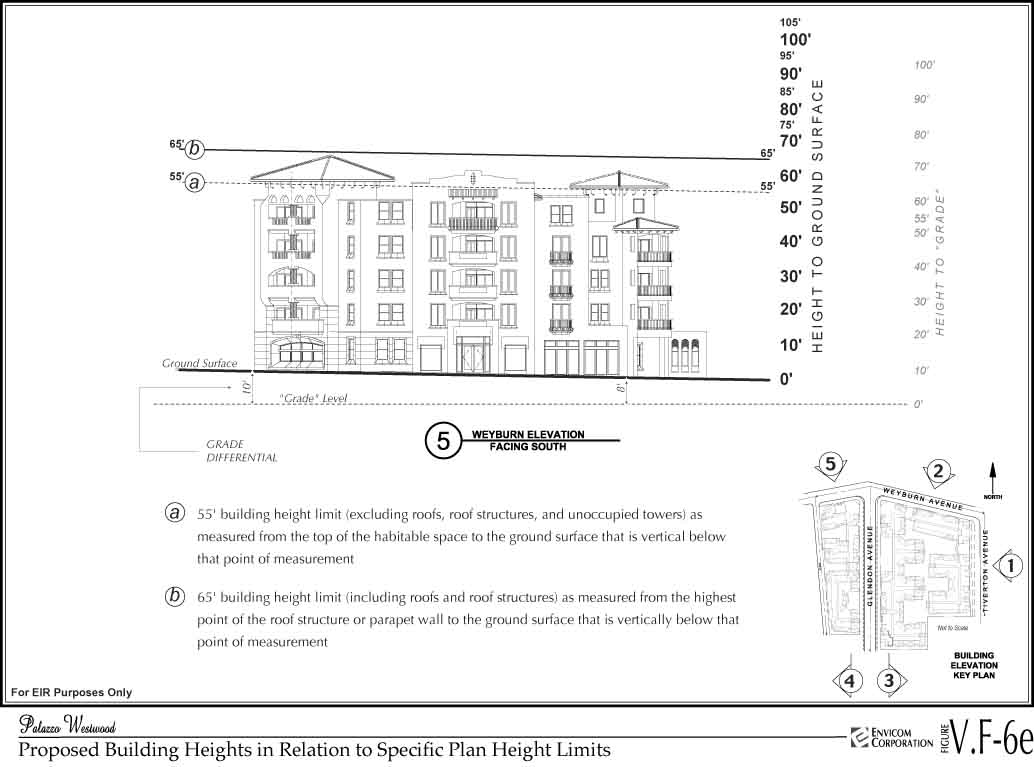
Figure V.F-6e Proposed Building Height in Relation to Specific Plan Height Limits (86k)
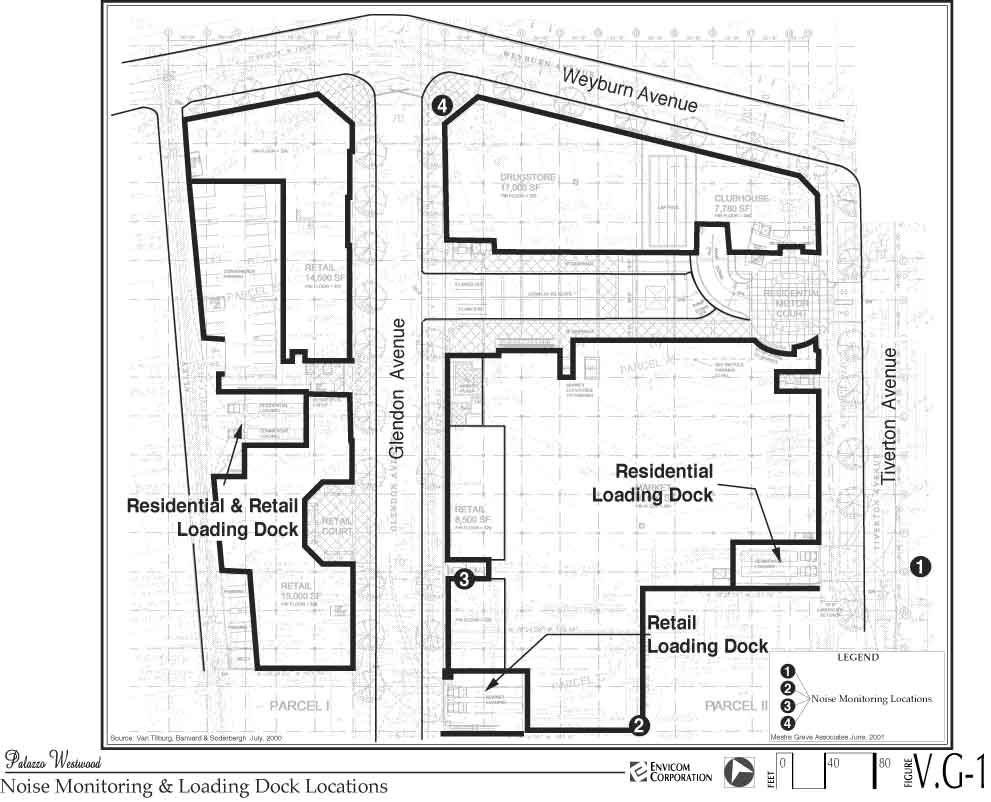
Figure V.G-1 Noise Monitoring and Loading Dock Locations (102k)
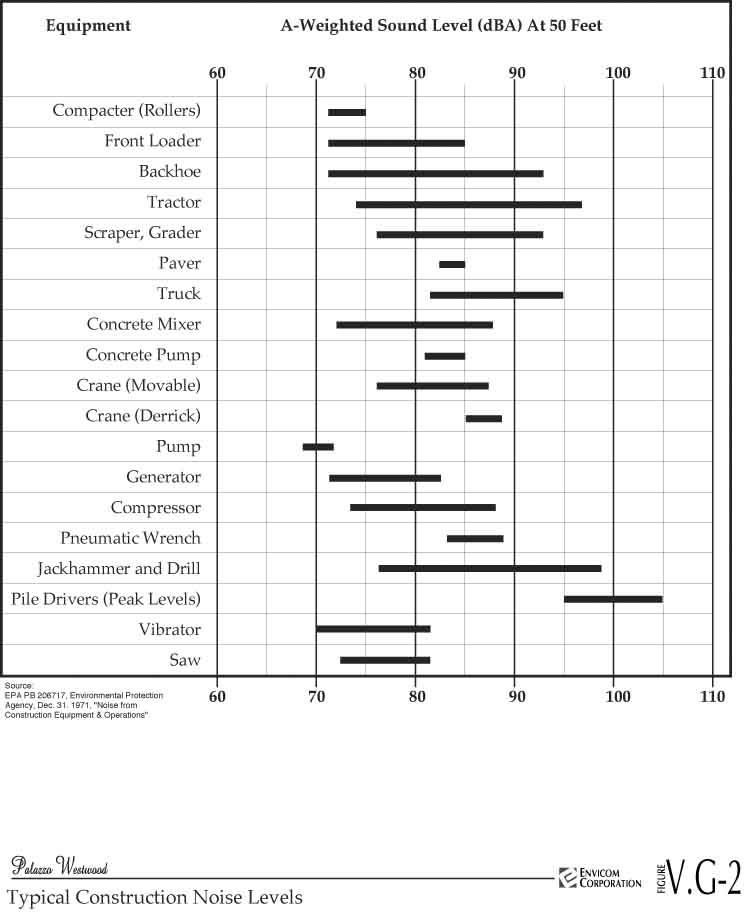
Figure V.G-2 Typical Construction Equipment Noise Levels (76k)
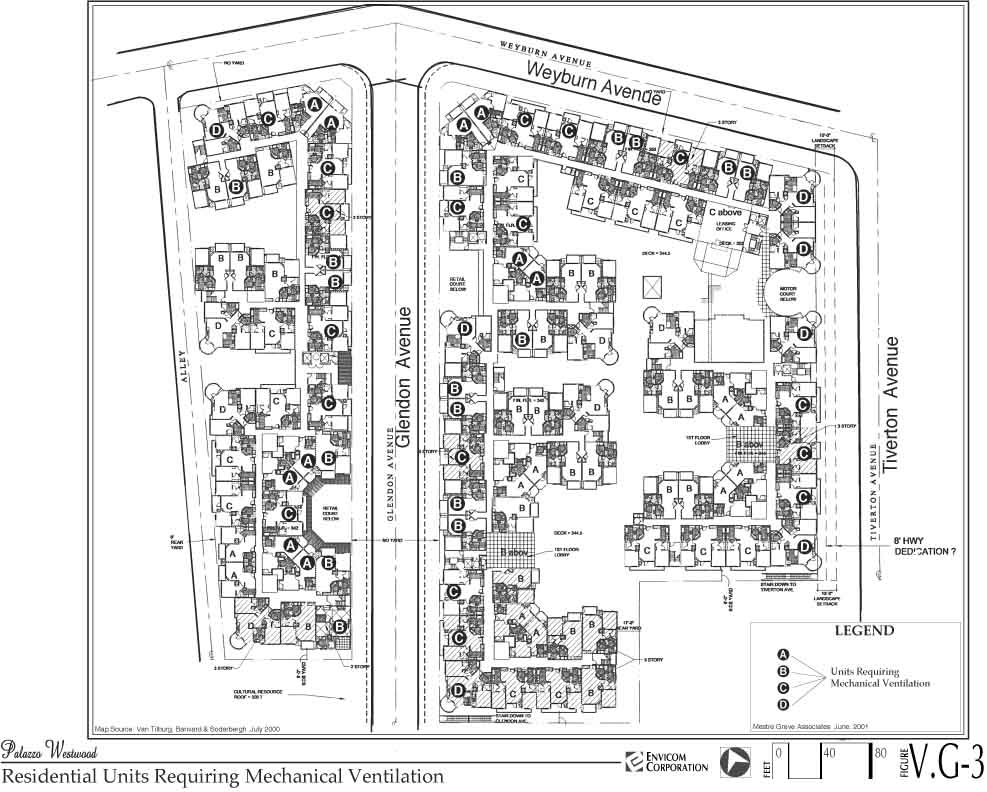
Figure V.G-3 Residential Units Requiring Mechanical Ventilation (138k)
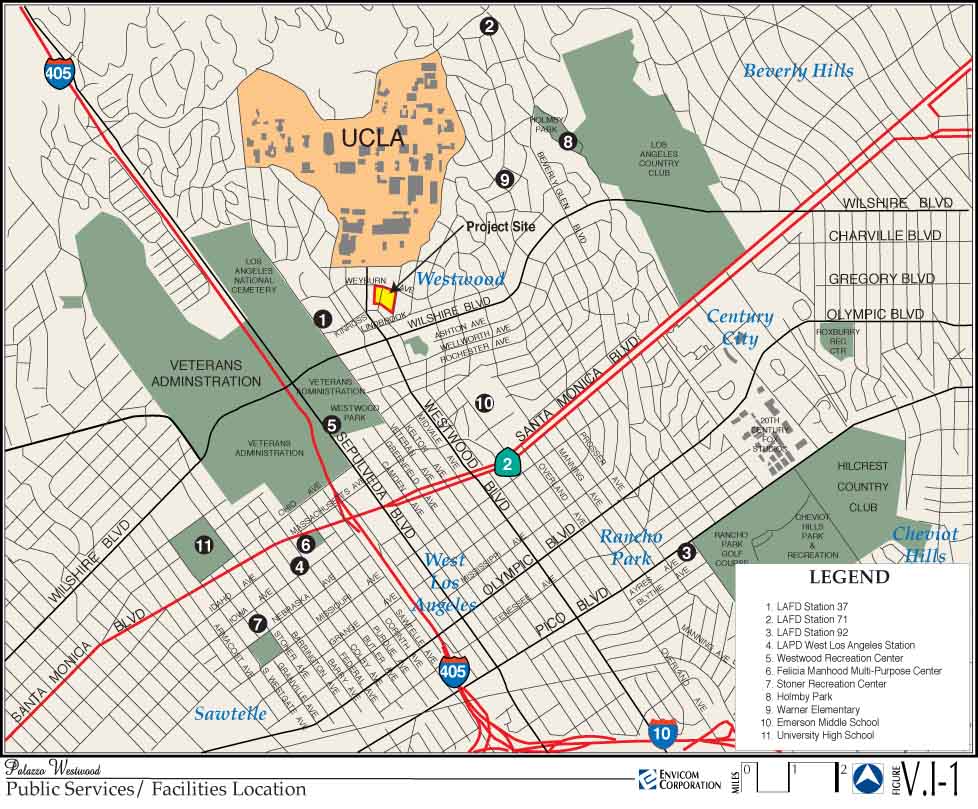
Figure V.I-1 Public Services / Facilities Locations (187k)
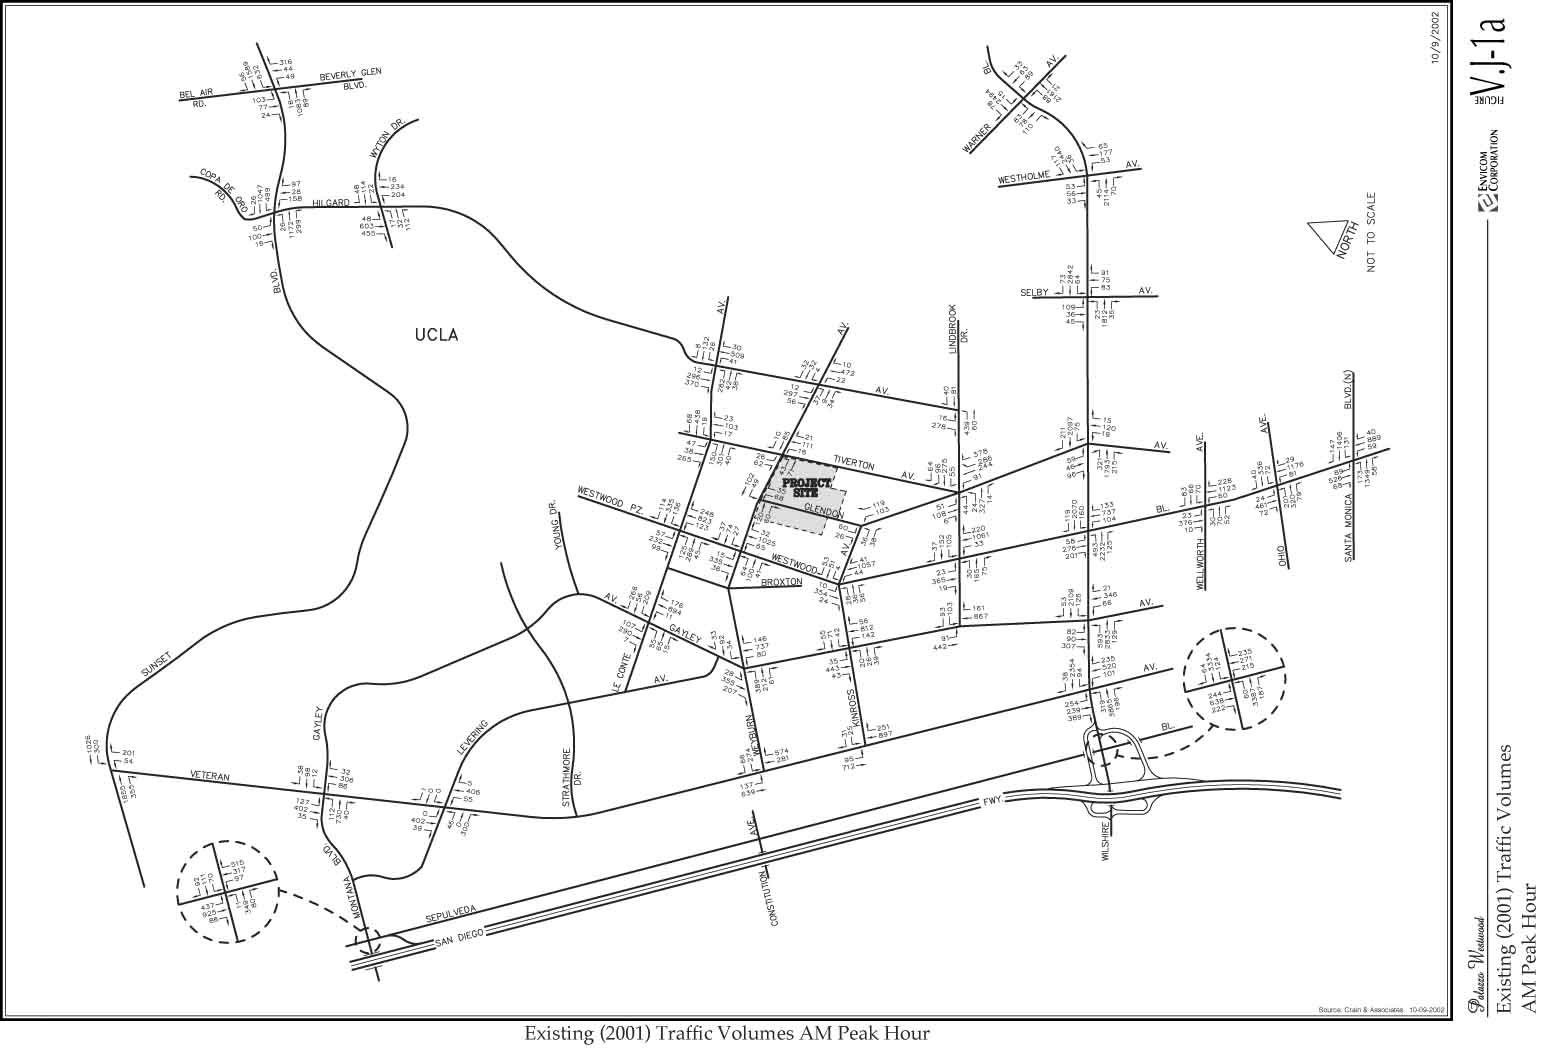
Figure V.J-1a Existing (2001) Traffic Volumes- AM Peak Hour (119k)
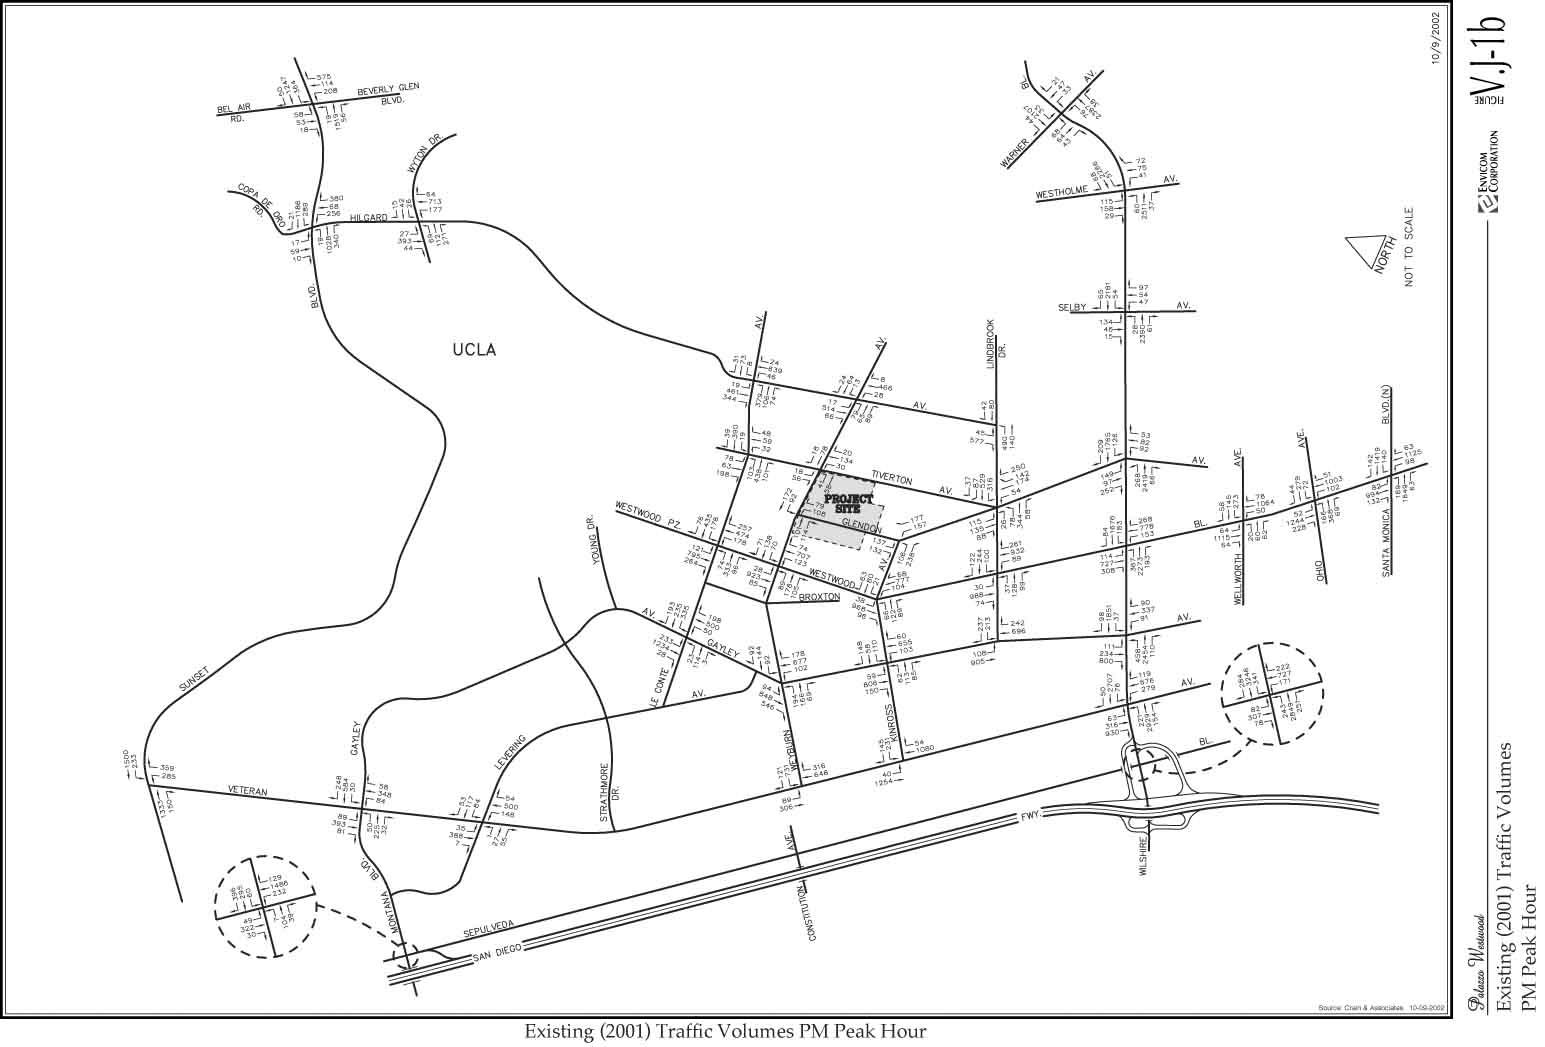
Figure V.J-1b Existing (2001) Traffic Volumes- PM Peak Hour (120k)
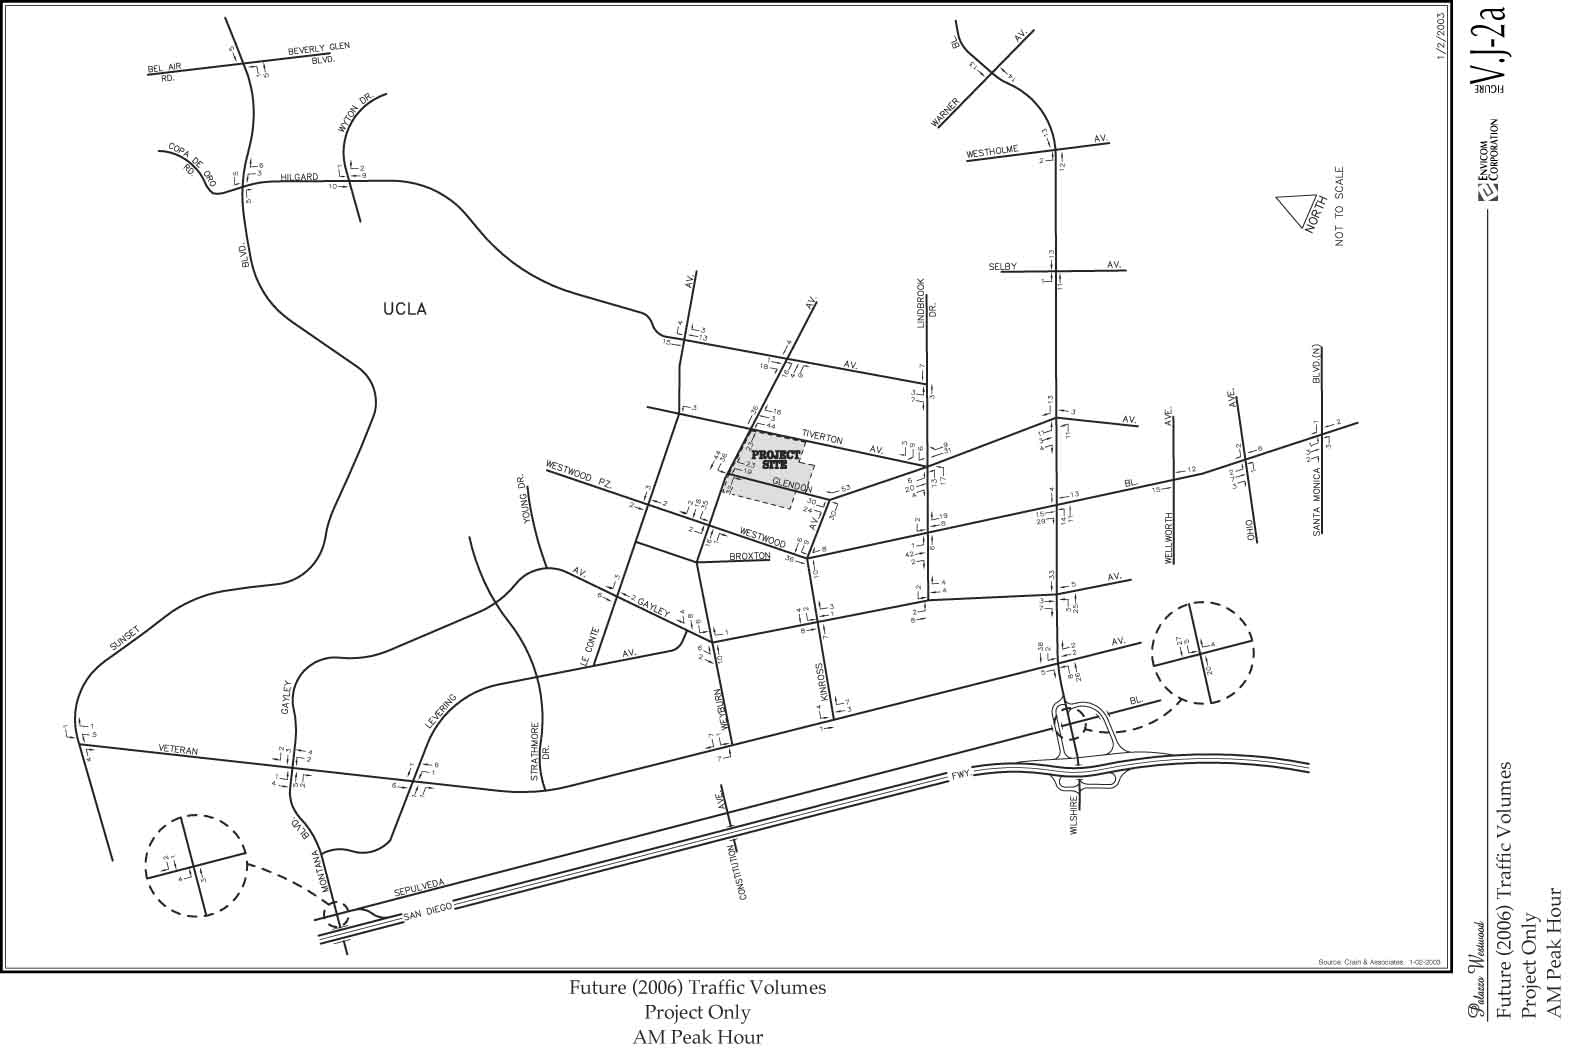
Figure V.J-2a Net Project Traffic Volumes- AM Peak Hour (104k)
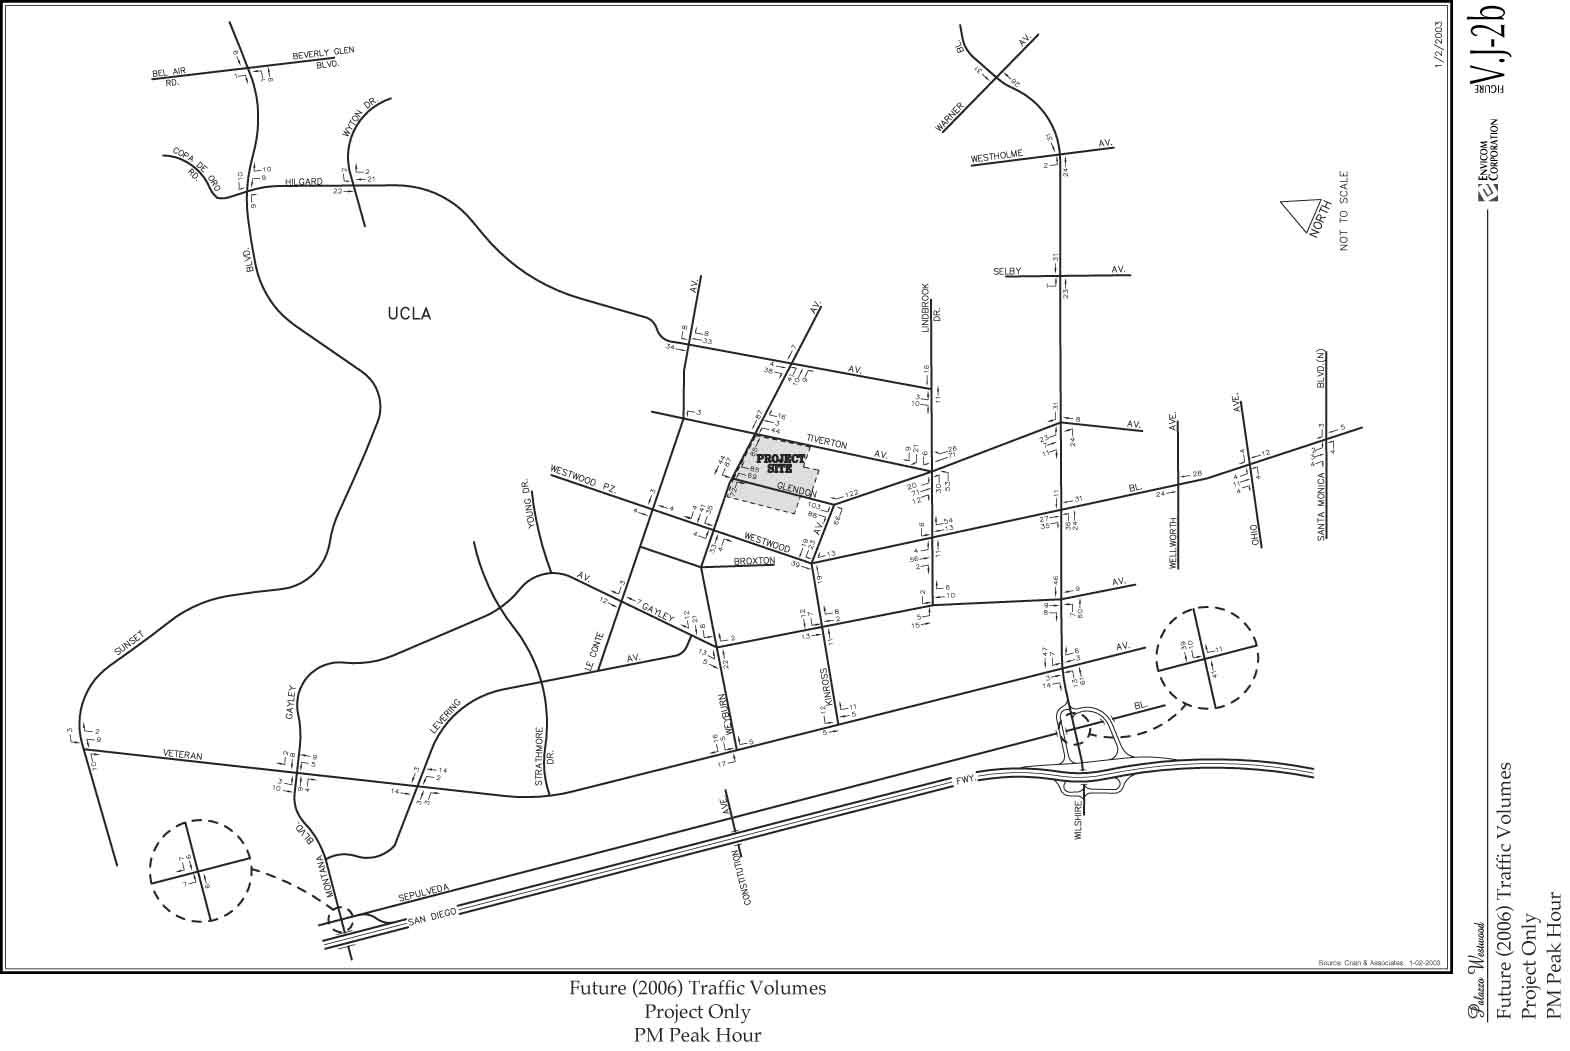
Figure V.J-2b Net Project Traffic Volumes- PM Peak Hour (104k)
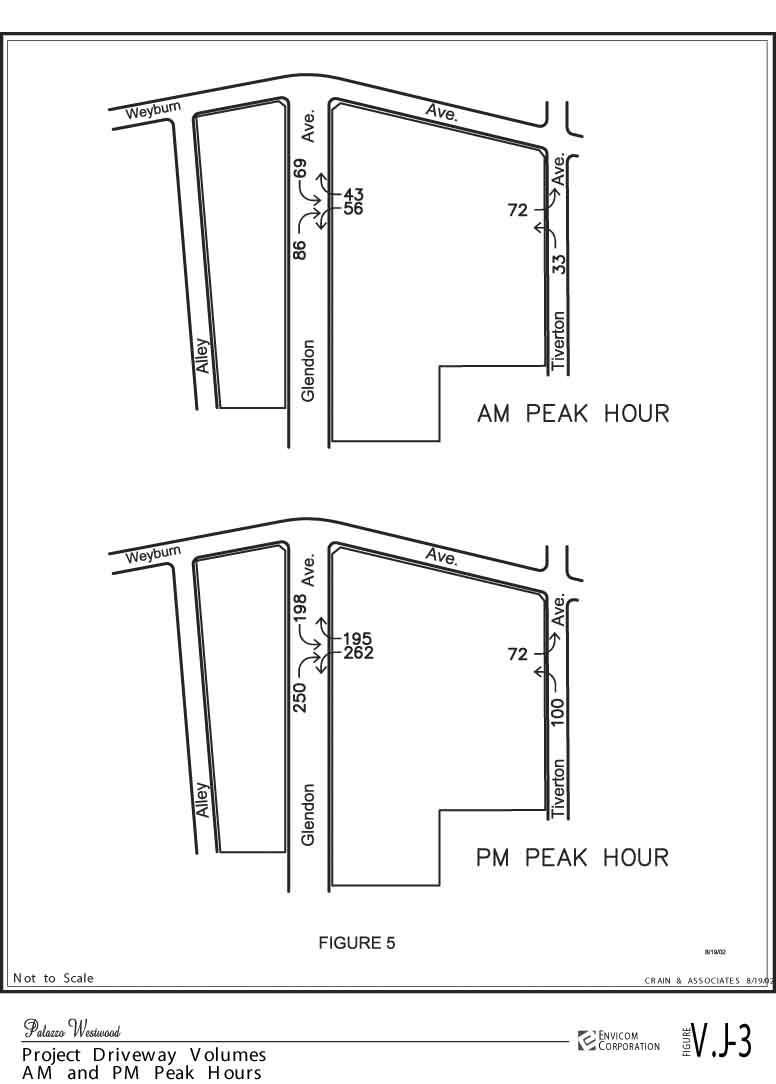
Figure V.J-3 Project Driveway Volumes (66k)
Figure V.J-4a Future (2006) Traffic Volumes Without Project - AM Peak Hour (120k)
Figure V.J-4b Future (2006) Traffic Volumes Without Project - PM Peak Hour (120k)
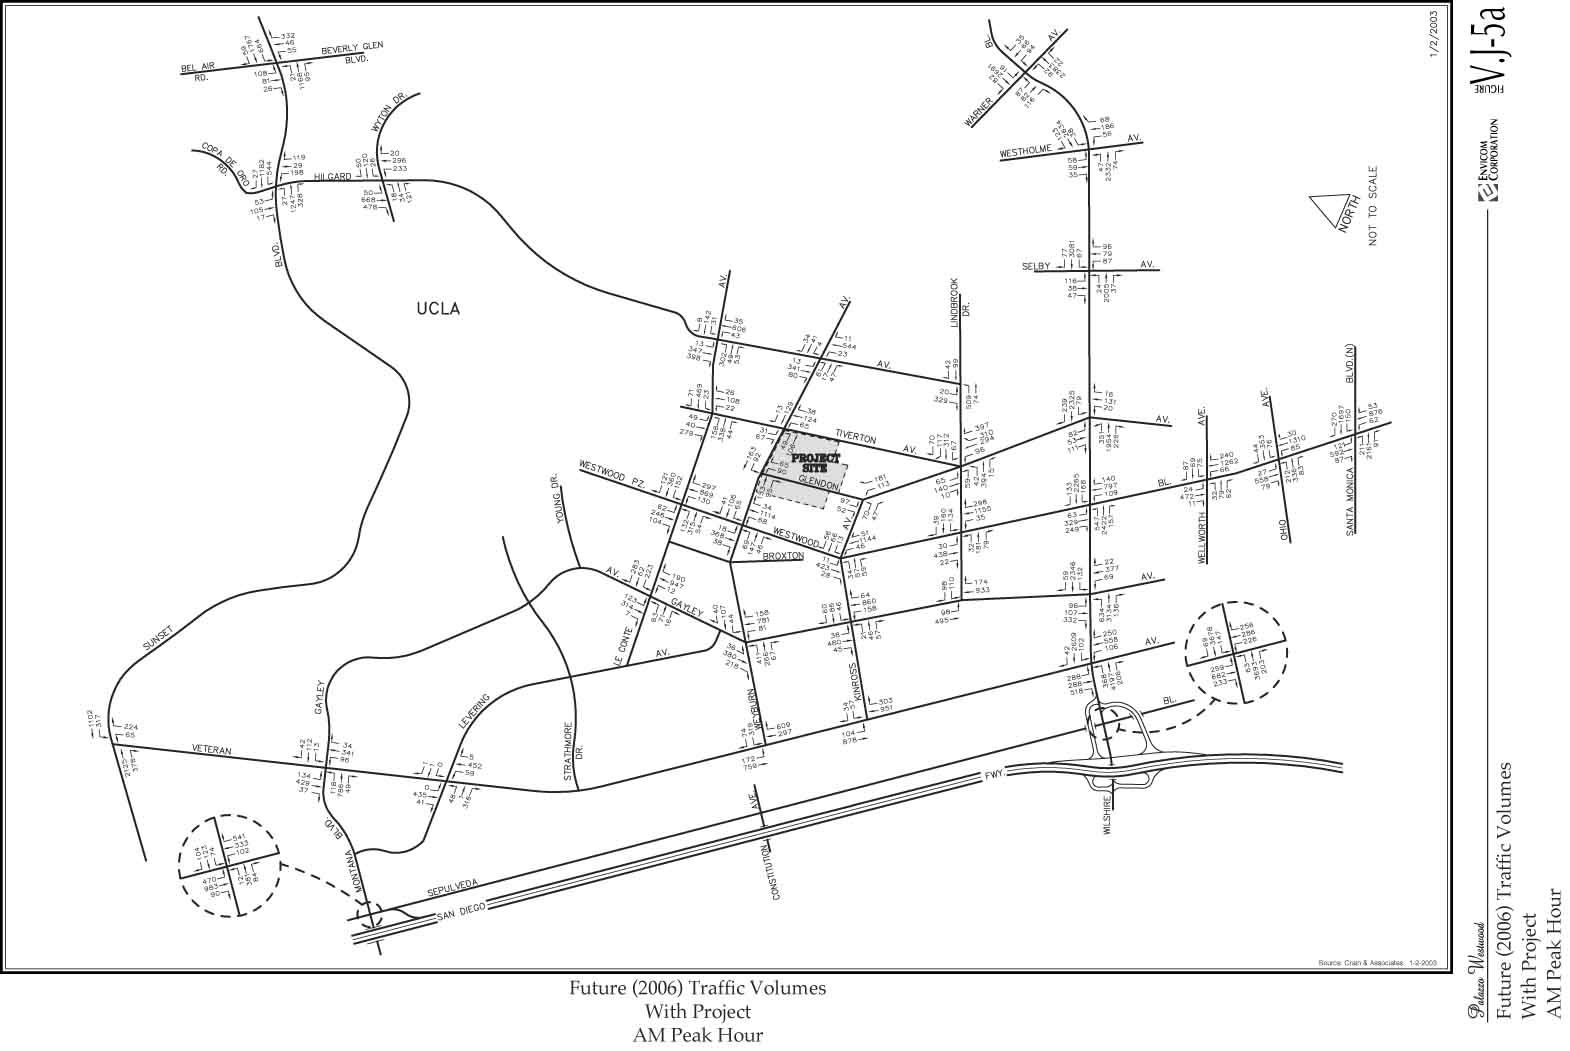
Figure V.J-5a Future (2006) Traffic Volumes With Project - AM Peak Hour (120k)
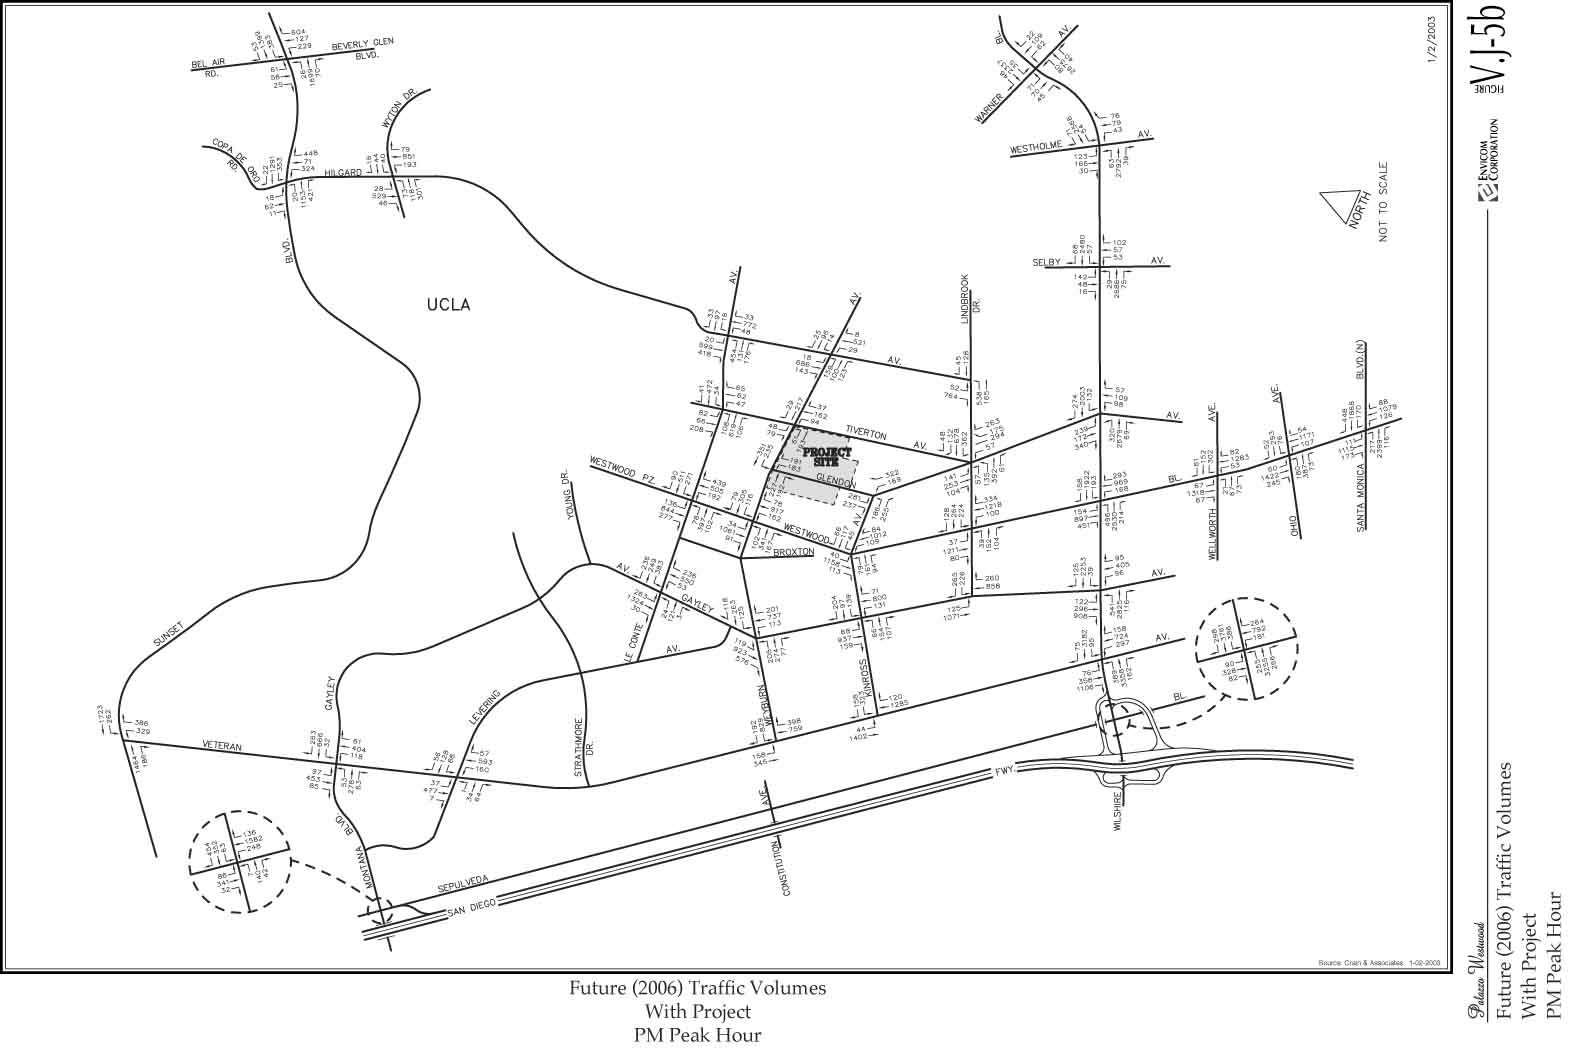
Figure V.J-5b Future (2006) Traffic Volumes With Project - PM Peak Hour (120k)
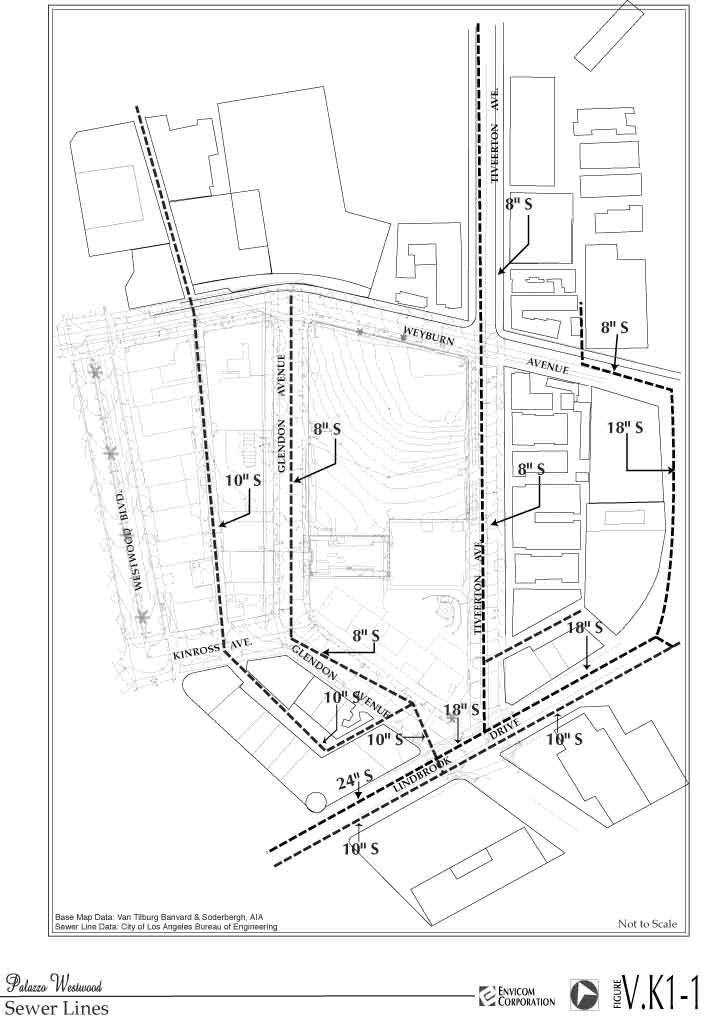
Figure V.K1-1 Sewer Lines (89k)
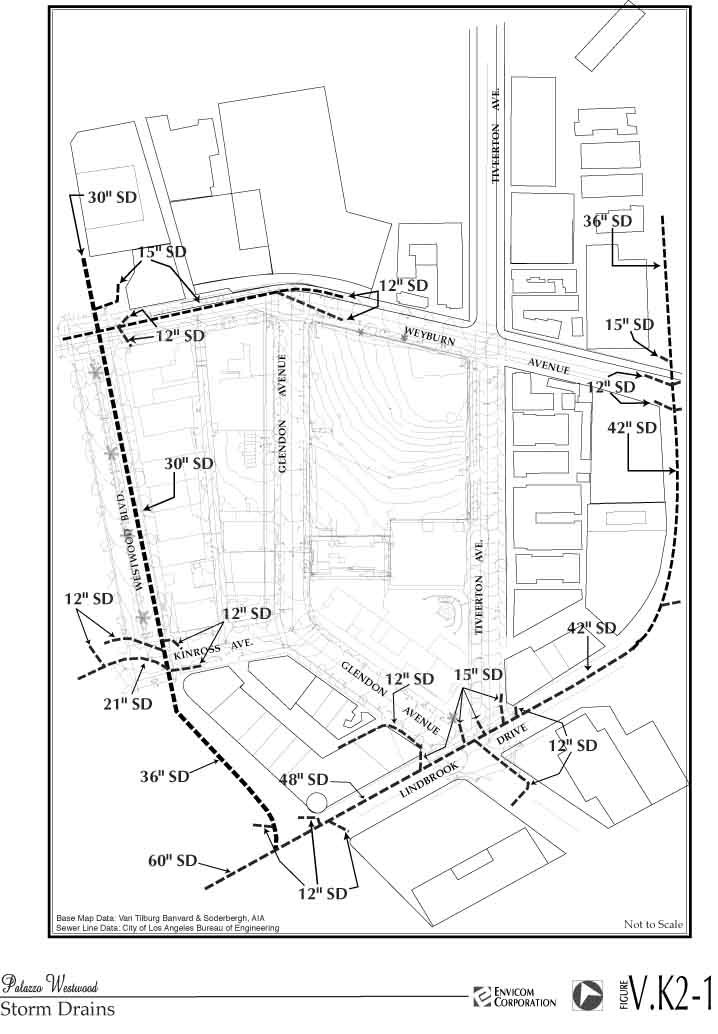
Figure V.K2-1 Storm Drains (96k)
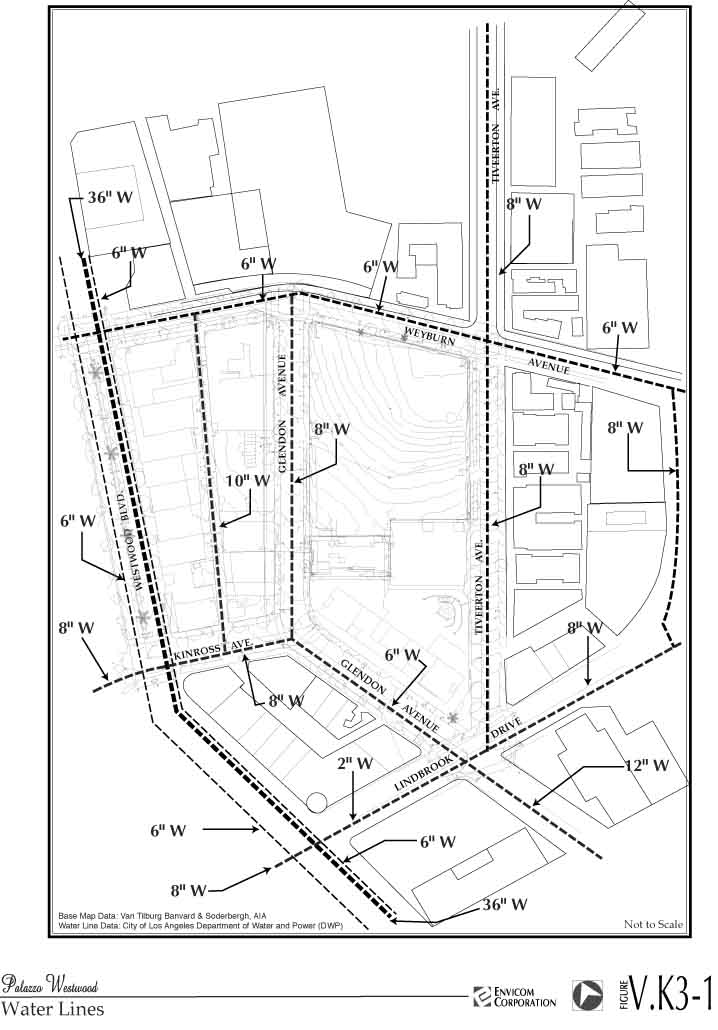
Figure V.K3-1 Domestic Water Lines (102k)
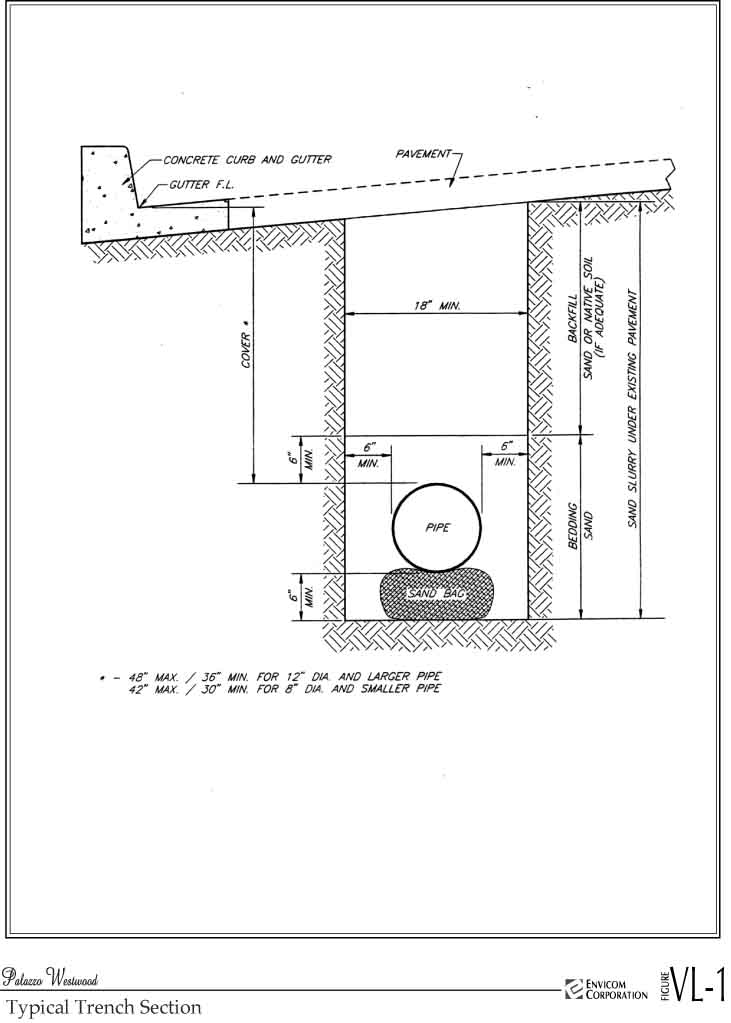
Figure V.L-1 Typical Trench Section and Trenching Detail (72k)
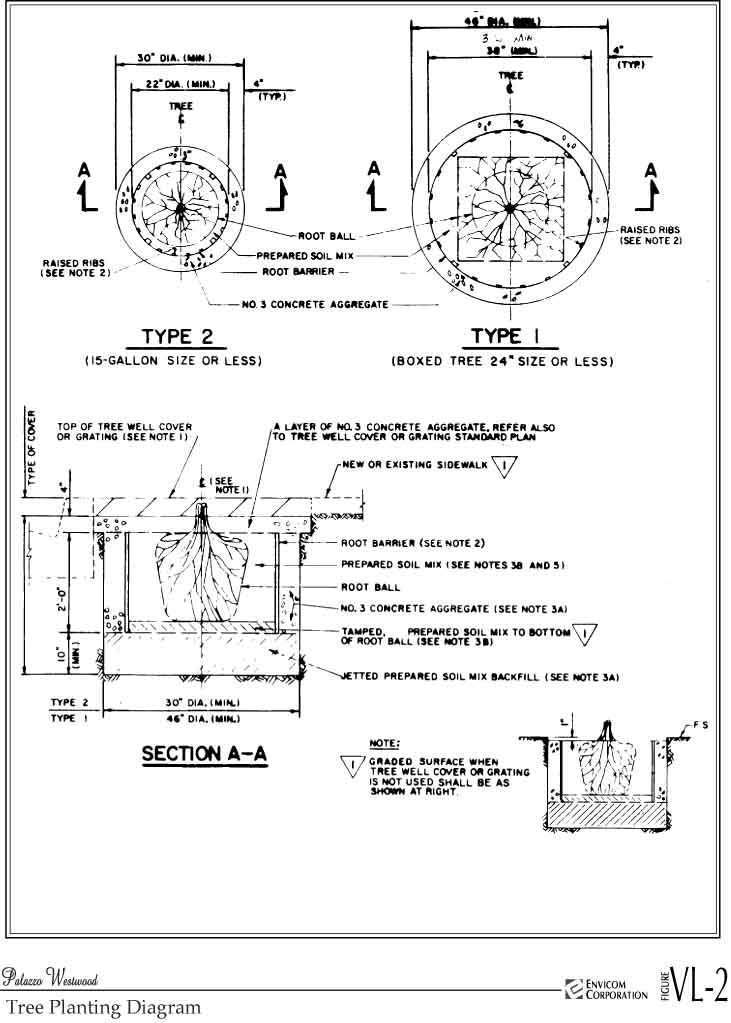
Figure V.L-2 Tree Planting Diagram (103k)
Figure V.L-3 Traffic Routes Available During the Demolition and Reconstruction of Glendon Avenue (122k)